

Question: please list points on graph ! 3 Homework - MS 3053 Management Science and Opere Consider the following linear program. Min 8X + 12Y St.
please list points on graph ! 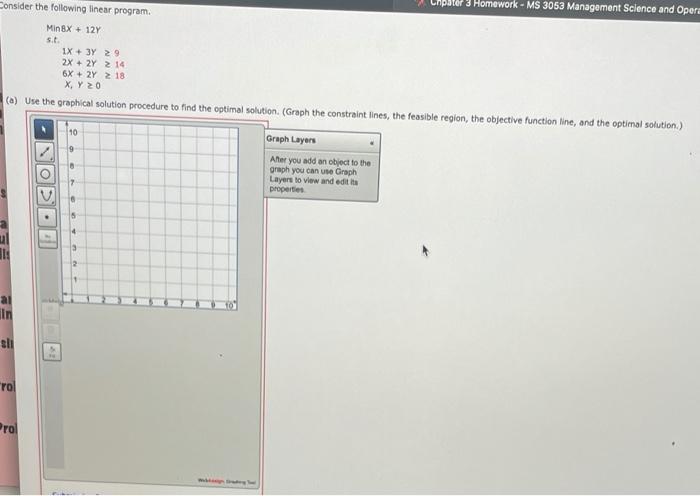

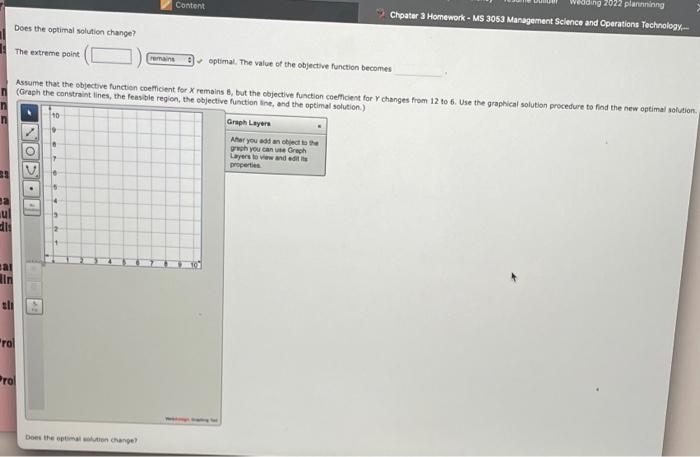
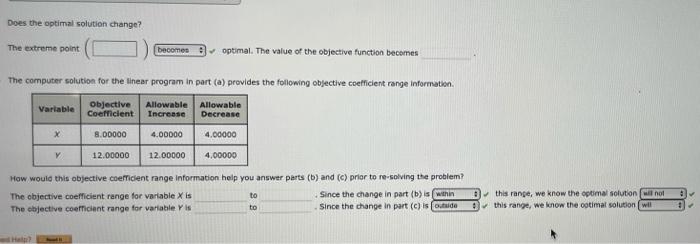
3 Homework - MS 3053 Management Science and Opere Consider the following linear program. Min 8X + 12Y St. 1X + 3Y 29 2x + 2 2 1 6X + 2Y + 18 X, Y 20 (a) Use the graphical solution procedure to find the optimal solution. (Graph the constraint lines, the feasible region, the objective function line, and the optimal solution) 10 Graph Layers CON After you add an object to the graph you can use Graph Layers to view and edit ita properties ai in sli rol Pro Assume that the objective function coefficient for changes from 3 to 6. Use the graphical solution procedure to find the new optimal solution (Graph the constraint lines, the feasible region, the objective function line, and the optimal solution) 10 ONOBO. Graph Layers Ater you add an object to the graph you can use Graph Layers to view and est properties 11 Does the main change Content 2022 planning Choatur 3 Homework - MS 3063 Management Science and Operations Technology Does the optimal solution change? The extreme point remains optimal. The value of the objective function becomes Assume that the objective function coefficient for X remains 8, but the objective function coefficient for changes from 12 to 6. Use the graphical solution procedure to find the new optimal solution (Graph the constraint lines, the feasible region, the objective function in, and the optimal solution) Graph Layer Aher you at an object to the gruph you can use Grech Layers to view and edit the properties NO. 38 12 ul al Rin sli rol Pro Does the optimation Change! Does the optimal solution change? The extreme point becomes optimal. The value of the objective function becomes The computer solution for the linear program in part () provides the following objective coefficient range Information Variable Objective Allowable Allowable Coefficient Increase Decrease x 8.00000 4.00000 4.00000 12.00000 12.00000 4,00000 How would this objective coeficient range information help you answer parts (6) and (c) prior to resolving the problem? The objective coefficient range for variable X is to Since the change in part(b) is within The objective coefficient range for variable is to Since the change in part (c) istide this range, we know the optimal solution will not this range, we know the otimal solution wil Step by Step Solution
There are 3 Steps involved in it
1 Expert Approved Answer
Step: 1 Unlock

Question Has Been Solved by an Expert!
Get step-by-step solutions from verified subject matter experts
Step: 2 Unlock
Step: 3 Unlock