

Question: Please List the steps to get the answer 9. Switch to the Profit Projections worksheet. This worksheet shows cost and sales numbers for 2021, a
Please List the steps to get the answer
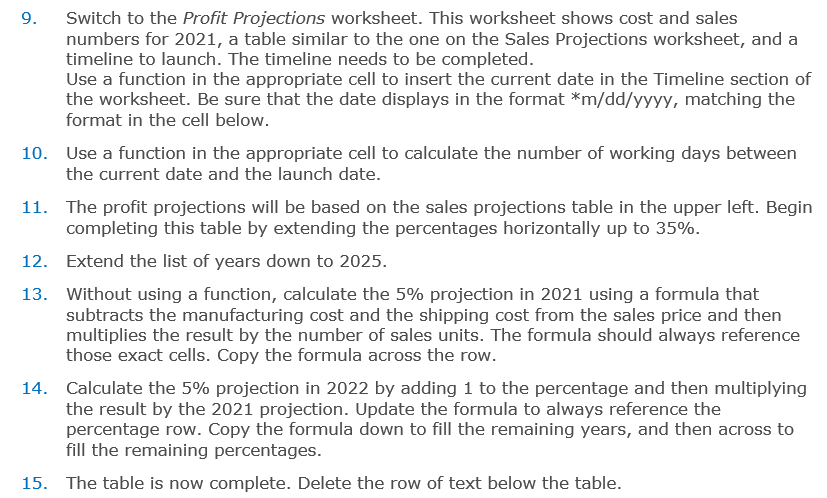
9. Switch to the Profit Projections worksheet. This worksheet shows cost and sales numbers for 2021, a table similar to the one on the Sales Projections worksheet, and a timeline to launch. The timeline needs to be completed. Use a function in the appropriate cell to insert the current date in the Timeline section of the worksheet. Be sure that the date displays in the format *m/dd/yyyy, matching the format in the cell below. 10. Use a function in the appropriate cell to calculate the number of working days between the current date and the launch date. 11. The profit projections will be based on the sales projections table in the upper left. Begin completing this table by extending the percentages horizontally up to 35%. 12. Extend the list of years down to 2025. 13. Without using a function, calculate the 5% projection in 2021 using a formula that subtracts the manufacturing cost and the shipping cost from the sales price and then multiplies the result by the number of sales units. The formula should always reference those exact cells. Copy the formula across the row. 14. Calculate the 5% projection in 2022 by adding 1 to the percentage and then multiplying the result by the 2021 projection. Update the formula to always reference the percentage row. Copy the formula down to fill the remaining years, and then across to fill the remaining percentages. 15. The table is now complete. Delete the row of text below the tableStep by Step Solution
There are 3 Steps involved in it
1 Expert Approved Answer
Step: 1 Unlock

Question Has Been Solved by an Expert!
Get step-by-step solutions from verified subject matter experts
Step: 2 Unlock
Step: 3 Unlock