

Question: Please look at photo to answer question below: What conclusion should you make based on the given data?a. Fail to reject Ho due to insufficient
Please look at photo to answer question below: What conclusion should you make based on the given data?a. Fail to reject Ho due to insufficient evidence and conclude that the observed Betatail types correspond with Ms. Frizzle's predicted distribution.b.Fail to reject Ho due to sufficient evidence and conclude that the observed Betatail types correspond with Ms. Frizzle's predicted distribution.C.Accept Ho due to sufficient evidence and conclude that Ms. Frizzle's actualfrequencies correspond to her predicted distribution.d.Reject Ho due to insufficient evidence and conclude that at least one of theobserved Beta tail types does not correspond with Ms. Frizzle's predicteddistribution.e.Reject Ho due to sufficient evidence and conclude that at least one of the observedBeta tail types does not correspond with Ms. Frizzle's predicted distribution
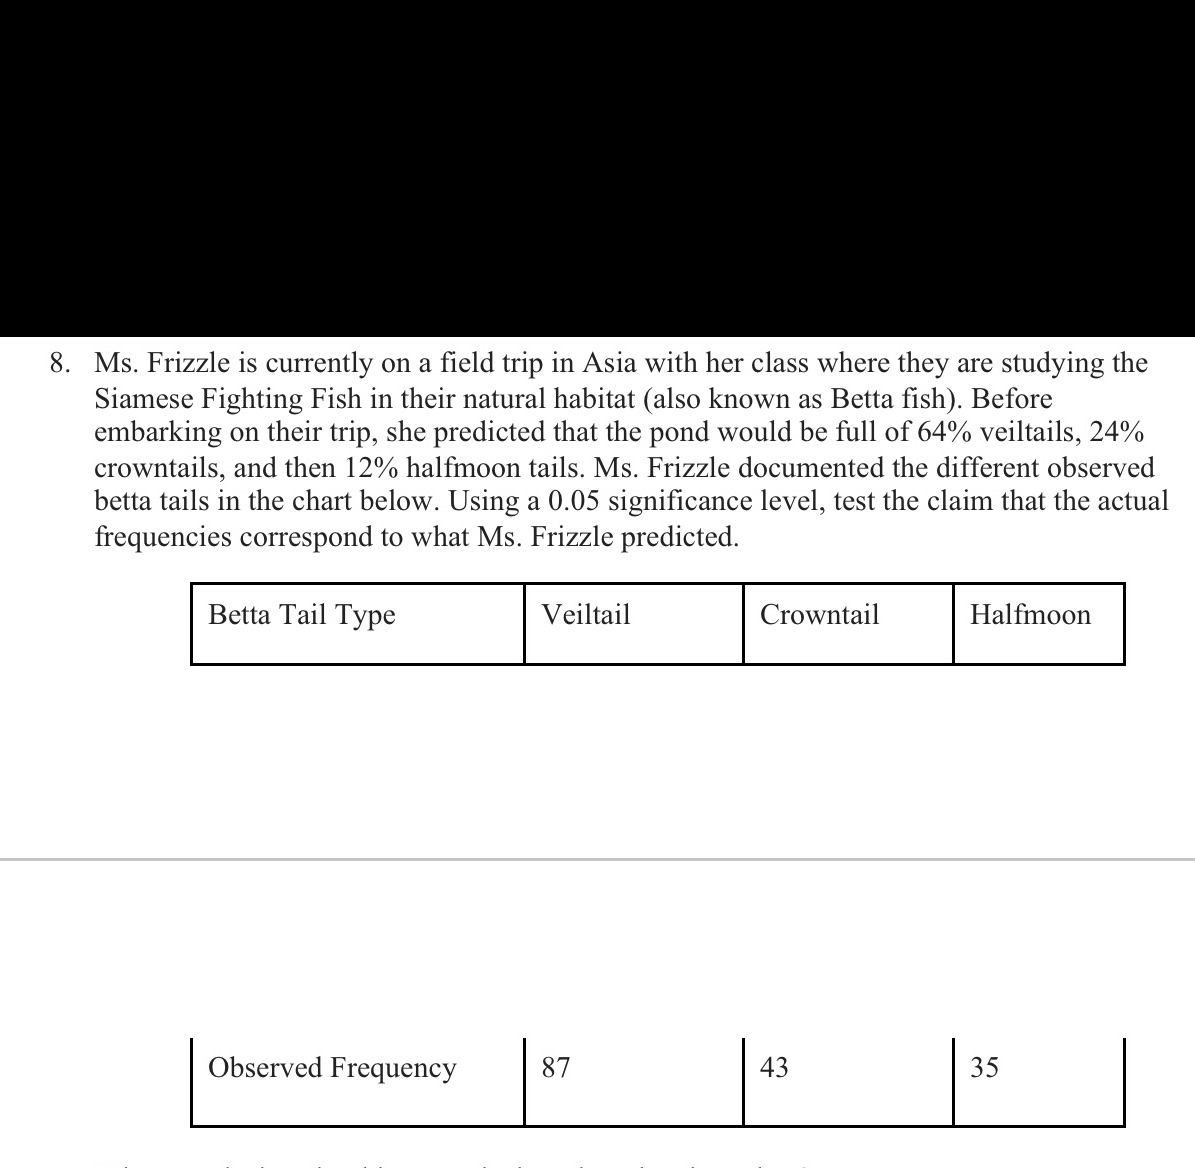
8. Ms. Frizzle is currently on a field trip in Asia with her class where they are studying the Siamese Fighting Fish in their natural habitat (also known as Betta fish). Before embarking on their trip, she predicted that the pond would be full of 64% veiltails, 24% crowntails, and then 12% halfmoon tails. Ms. Frizzle documented the different observed betta tails in the chart below. Using a 0.05 significance level, test the claim that the actual frequencies correspond to what Ms. Frizzle predicted. Betta Tail Type Veiltail Crowntail Halfmoon Observed Frequency 87 43 35
Step by Step Solution
There are 3 Steps involved in it

Get step-by-step solutions from verified subject matter experts