

Question: Please look at the question below and answer Thinking 17. Complete the table in identifying the sources of bias in the graph. [8 marks] Crime
Please look at the question below and answer
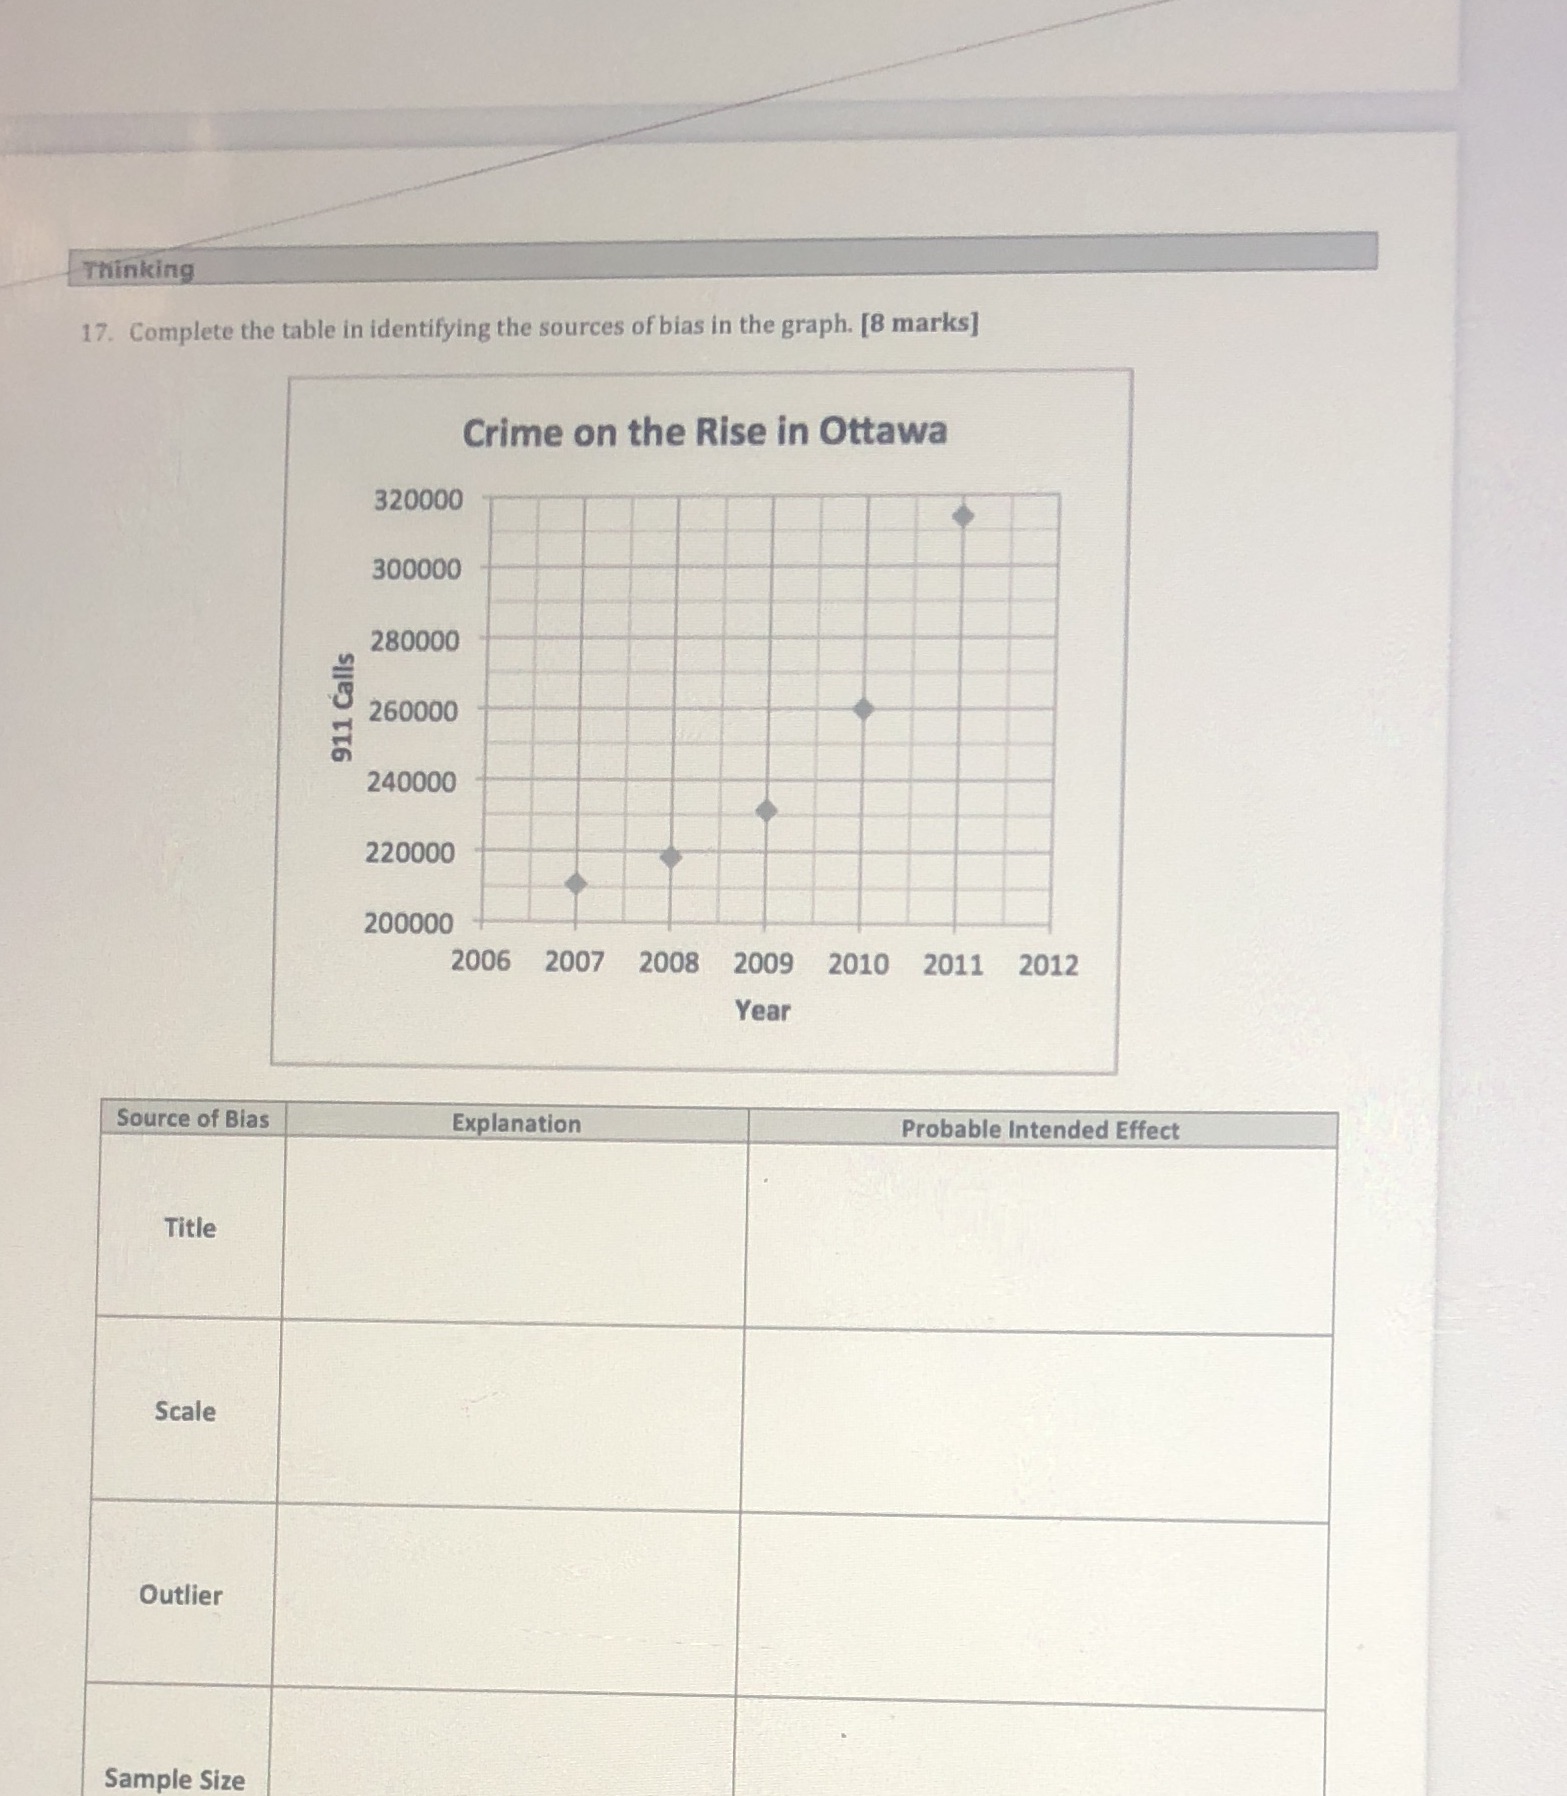
Thinking 17. Complete the table in identifying the sources of bias in the graph. [8 marks] Crime on the Rise in Ottawa 320000 300000 280000 911 Calls 260000 240000 220000 200000 2006 2007 2008 2009 2010 2011 2012 Year Source of Bias Explanation Probable Intended Effect Title Scale Outlier Sample Size
Step by Step Solution
There are 3 Steps involved in it
1 Expert Approved Answer
Step: 1 Unlock

Question Has Been Solved by an Expert!
Get step-by-step solutions from verified subject matter experts
Step: 2 Unlock
Step: 3 Unlock