

Question: Please look at the sample below to answer the following questions. Questions: Using percentage differences in this sample, which country's citizens were more likely to
Please look at the sample below to answer the following questions.
Questions:
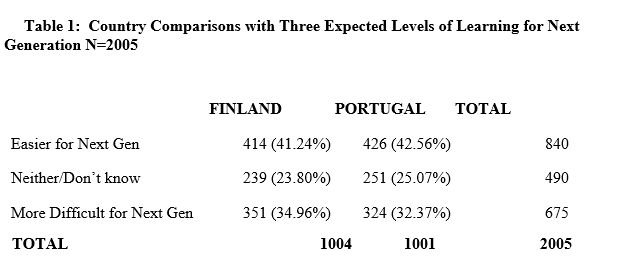
- Using percentage differences in this sample, which country's citizens were more likely to believe that life for the next generation would be easier/more difficult?
- Calculate the Degree of Freedom (df) for the table above.
- Identify the Critical Value for the data above using the Critical Value Table
- Using chi-square, can we confidently claim that Finnish and Portuguese citizens differ in their views in the population from which these samples were randomly drawn? Be precise in your answer.
\f
Step by Step Solution
There are 3 Steps involved in it
1 Expert Approved Answer
Step: 1 Unlock

Question Has Been Solved by an Expert!
Get step-by-step solutions from verified subject matter experts
Step: 2 Unlock
Step: 3 Unlock