

Question: Please make a balance sheet from this income statement January to December 2023 Financial Statements in US Dollars Revenue Gross Sales Less: Sales Returns and
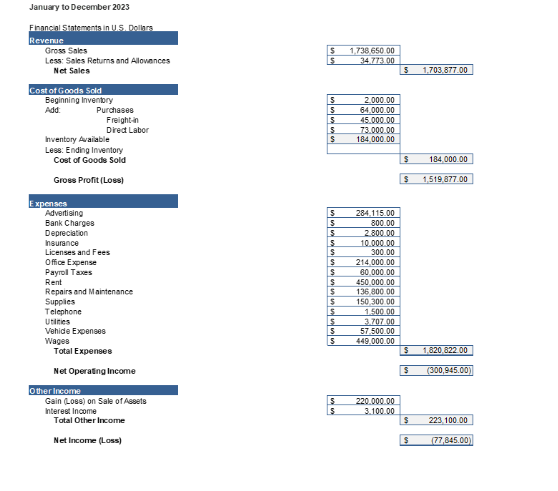
Please make a balance sheet from this income statement
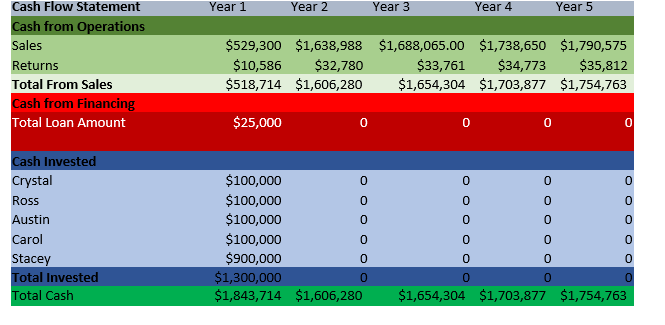
January to December 2023 Financial Statements in US Dollars Revenue Gross Sales Less: Sales Returns and Allowances Net Sales S S 1,738 650 00 34 773 00 5 1,703 877.00 5 $ 5 Cost of Goods Sold Beginning Inventory Add Purchases Freight in Direct Labor Inventory Available Less Ending Inventory Cost of Goods Sold 2.000.00 64.000.00 45.000.00 73.000.00 184,000.00 $ $ 184 000 00 Gross Profit (Loss) $ 1519 877 00 xpenses Advertising Bank Charges Depreciation Insurance Licenses and Fees Office Expense Payroll Taxes Rent Repairs and Maintenance Supplies Telephone Utilities Vehide Expenses Wages Total Expenses 5 5 5 5 $ S $ $ $ $ $ s 5 5 284.115.00 800.00 2.800.00 10.000.00 300.00 214,000.00 80 000.00 450,000.00 136 800 00 150 300 00 1.500.00 370700 57.500.00 449.000.00 S 1.82032200 (300,945.00) S Net Operating Income Other Income Gain (Loss) on Sale of Assets Interest Income Total Other Income S IS 220.000.00 3.100.00 S 223,100.00 Net Income (Loss) $ 77,845.00) Year 1 Year 2 Year 3 Year 4 Year 5 Cash Flow Statement Cash from Operations Sales Returns Total From Sales Cash from Financing Total Loan Amount $529,300 $1,638,988 $1,688,065.00 $1,738,650 $1,790,575 $10,586 $32,780 $33,761 $34,773 $35,812 $518,714 $1,606,280 $1,654,304 $1,703,877 $1,754,763 $25,000 0 0 0 0 0 0 0 0 0 0 0 0 0 Cash Invested Crystal Ross Austin Carol Stacey Total Invested Total Cash $100,000 0 $100,000 0 $100,000 0 $100,000 0 $900,000 0 $1,300,000 0 $1,843,714 $1,606,280 0 0 0 0 0 0 0 0 0 $1,654,304 $1,703,877 $1,754,763 January to December 2023 Financial Statements in US Dollars Revenue Gross Sales Less: Sales Returns and Allowances Net Sales S S 1,738 650 00 34 773 00 5 1,703 877.00 5 $ 5 Cost of Goods Sold Beginning Inventory Add Purchases Freight in Direct Labor Inventory Available Less Ending Inventory Cost of Goods Sold 2.000.00 64.000.00 45.000.00 73.000.00 184,000.00 $ $ 184 000 00 Gross Profit (Loss) $ 1519 877 00 xpenses Advertising Bank Charges Depreciation Insurance Licenses and Fees Office Expense Payroll Taxes Rent Repairs and Maintenance Supplies Telephone Utilities Vehide Expenses Wages Total Expenses 5 5 5 5 $ S $ $ $ $ $ s 5 5 284.115.00 800.00 2.800.00 10.000.00 300.00 214,000.00 80 000.00 450,000.00 136 800 00 150 300 00 1.500.00 370700 57.500.00 449.000.00 S 1.82032200 (300,945.00) S Net Operating Income Other Income Gain (Loss) on Sale of Assets Interest Income Total Other Income S IS 220.000.00 3.100.00 S 223,100.00 Net Income (Loss) $ 77,845.00) Year 1 Year 2 Year 3 Year 4 Year 5 Cash Flow Statement Cash from Operations Sales Returns Total From Sales Cash from Financing Total Loan Amount $529,300 $1,638,988 $1,688,065.00 $1,738,650 $1,790,575 $10,586 $32,780 $33,761 $34,773 $35,812 $518,714 $1,606,280 $1,654,304 $1,703,877 $1,754,763 $25,000 0 0 0 0 0 0 0 0 0 0 0 0 0 Cash Invested Crystal Ross Austin Carol Stacey Total Invested Total Cash $100,000 0 $100,000 0 $100,000 0 $100,000 0 $900,000 0 $1,300,000 0 $1,843,714 $1,606,280 0 0 0 0 0 0 0 0 0 $1,654,304 $1,703,877 $1,754,763
Step by Step Solution
There are 3 Steps involved in it

Get step-by-step solutions from verified subject matter experts