

Question: please make a chart and show your financial work for CAGRS on gross profit and operating income based on the attachment below. thank you please
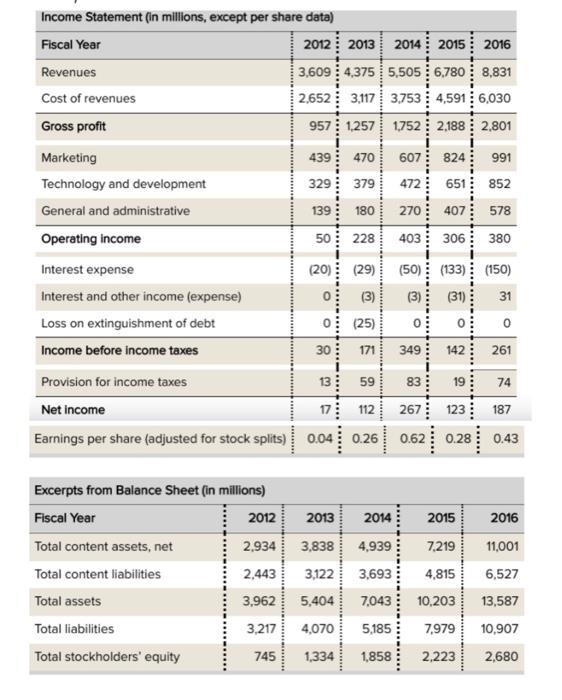
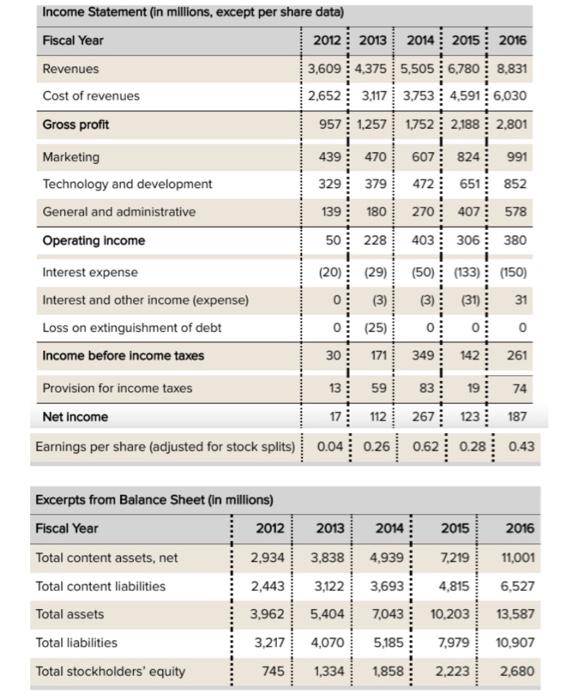
470 991 180 Income Statement (in millions, except per share data) Fiscal Year 2012 2013 2014 2015 2016 Revenues 3,609 : 4,375 5,5056,780 8,831 Cost of revenues 2.652 3,117 3.753 4,591 : 6,030 Gross profit 957 1,257 1752 2,188 2.801 Marketing 439 607 824 Technology and development 329 379 472 651 852 General and administrative 139 270407 578 Operating income 50 228 403 380 Interest expense (20) (29) (50) (133) (150) Interest and other income (expense) 0 (3) (3) (31) 31 Loss on extinguishment of debt 0 (25) 0 Income before income taxes 30 349 142 261 Provision for income taxes 13 83 19 74 Net income 17 112 267 123 187 Earnings per share (adjusted for stock splits) 0.04 0.26 0.43 306 0 0 171 ... 59 0.04 0.26 0.62 0.28 2016 2013 3,838 11,001 Excerpts from Balance Sheet (in millions) Fiscal Year 2012 Total content assets, net 2.934 Total content liabilities 2,443 Total assets 3.962 Total liabilities 3,217 Total stockholders' equity 745 3,122 2014 2015 4,939 7,219 3,693 4,815 7,043 10,203 5,185 7,979 6,527 5,404 13,587 4,070 10,907 1,334 1,858 2,223 2,680 Income Statement (in millions, except per share data) Fiscal Year 2012 2013 2014 2015 2016 Revenues 3,609 : 4,375 5,5056,780 8,831 Cost of revenues 2.652 3,117 3,753 4,591 6,030 Gross profit 957 1,257 1,752 2,188 2,801 470 607 824 991 379 472 651 852 439 329 139 180 50 228 270 407 578 403 306 380 Marketing Technology and development General and administrative Operating income Interest expense Interest and other income (expense) Loss on extinguishment of debt Income before income taxes (50) (133) (150) (3) (31) 31 ( (20) (29) 0: (3) 0 (25) 30 171 0 0 349 142 261 Provision for income taxes 74 13 591 17 112 83 19 267 123 187 Net Income Earnings per share (adjusted for stock splits) 0.04 0.26 0.62 0.28 0.43 R. 2014 2015 2016 Excerpts from Balance Sheet (in millions) Fiscal Year 2012 Total content assets, net 2,934 Total content liabilities 2,443 2013 3,838 3,122 4,939 11,001 7,219 4.815 3,693 6,527 Total assets 3,962 7,043 13,587 5,404 4,070 10,203 7.979 3,217 5,185 10,907 Total liabilities Total stockholders' equity 745 1,334 1,858 2,223 2,680 470 991 180 Income Statement (in millions, except per share data) Fiscal Year 2012 2013 2014 2015 2016 Revenues 3,609 : 4,375 5,5056,780 8,831 Cost of revenues 2.652 3,117 3.753 4,591 : 6,030 Gross profit 957 1,257 1752 2,188 2.801 Marketing 439 607 824 Technology and development 329 379 472 651 852 General and administrative 139 270407 578 Operating income 50 228 403 380 Interest expense (20) (29) (50) (133) (150) Interest and other income (expense) 0 (3) (3) (31) 31 Loss on extinguishment of debt 0 (25) 0 Income before income taxes 30 349 142 261 Provision for income taxes 13 83 19 74 Net income 17 112 267 123 187 Earnings per share (adjusted for stock splits) 0.04 0.26 0.43 306 0 0 171 ... 59 0.04 0.26 0.62 0.28 2016 2013 3,838 11,001 Excerpts from Balance Sheet (in millions) Fiscal Year 2012 Total content assets, net 2.934 Total content liabilities 2,443 Total assets 3.962 Total liabilities 3,217 Total stockholders' equity 745 3,122 2014 2015 4,939 7,219 3,693 4,815 7,043 10,203 5,185 7,979 6,527 5,404 13,587 4,070 10,907 1,334 1,858 2,223 2,680 Income Statement (in millions, except per share data) Fiscal Year 2012 2013 2014 2015 2016 Revenues 3,609 : 4,375 5,5056,780 8,831 Cost of revenues 2.652 3,117 3,753 4,591 6,030 Gross profit 957 1,257 1,752 2,188 2,801 470 607 824 991 379 472 651 852 439 329 139 180 50 228 270 407 578 403 306 380 Marketing Technology and development General and administrative Operating income Interest expense Interest and other income (expense) Loss on extinguishment of debt Income before income taxes (50) (133) (150) (3) (31) 31 ( (20) (29) 0: (3) 0 (25) 30 171 0 0 349 142 261 Provision for income taxes 74 13 591 17 112 83 19 267 123 187 Net Income Earnings per share (adjusted for stock splits) 0.04 0.26 0.62 0.28 0.43 R. 2014 2015 2016 Excerpts from Balance Sheet (in millions) Fiscal Year 2012 Total content assets, net 2,934 Total content liabilities 2,443 2013 3,838 3,122 4,939 11,001 7,219 4.815 3,693 6,527 Total assets 3,962 7,043 13,587 5,404 4,070 10,203 7.979 3,217 5,185 10,907 Total liabilities Total stockholders' equity 745 1,334 1,858 2,223 2,680
Step by Step Solution
There are 3 Steps involved in it

Get step-by-step solutions from verified subject matter experts