

Question: please make a graph or chart using the results below. How would you rate your excitement taking this data analysis class? Very Excited 6 25.00%
please make a graph or chart using the results below.
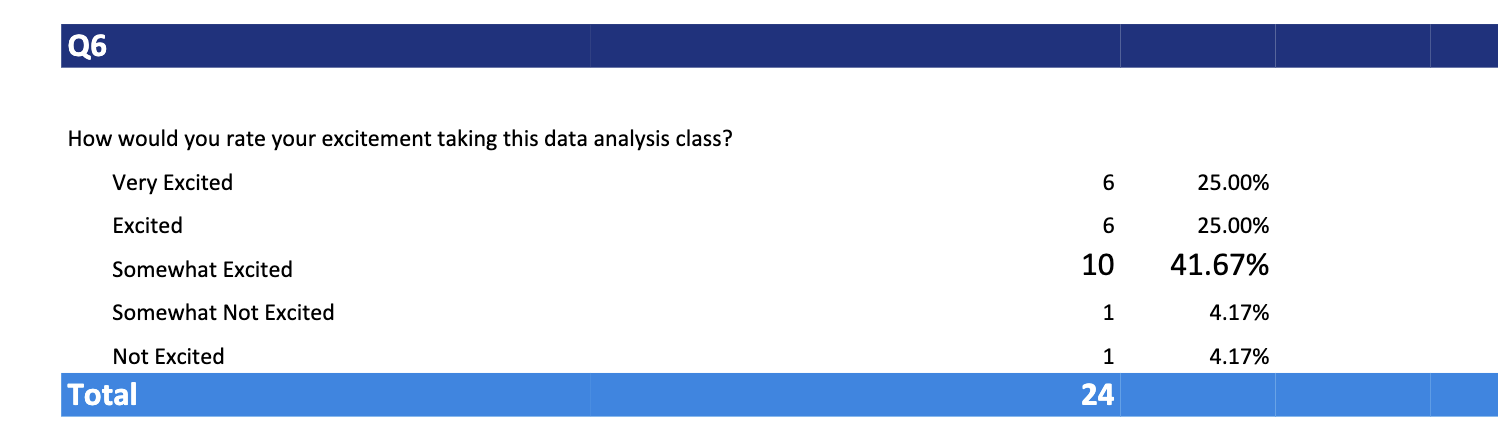
How would you rate your excitement taking this data analysis class? Very Excited 6 25.00% Excited 6 25.00% Somewhat Excited 10 41.57% Somewhat Not Excited 1 4.17% Not Excited 1 4.17% Total 24
Step by Step Solution
There are 3 Steps involved in it
1 Expert Approved Answer
Step: 1 Unlock

Question Has Been Solved by an Expert!
Get step-by-step solutions from verified subject matter experts
Step: 2 Unlock
Step: 3 Unlock