

Question: Please make a report (explanation) based on the above output. It shows the output after applying a linear regression model into this dataset : https://drive.google.com/file/d/1XqsEnwsLQ7QN1Q4aD30DIJePmiljr1tL/view?usp=share_link
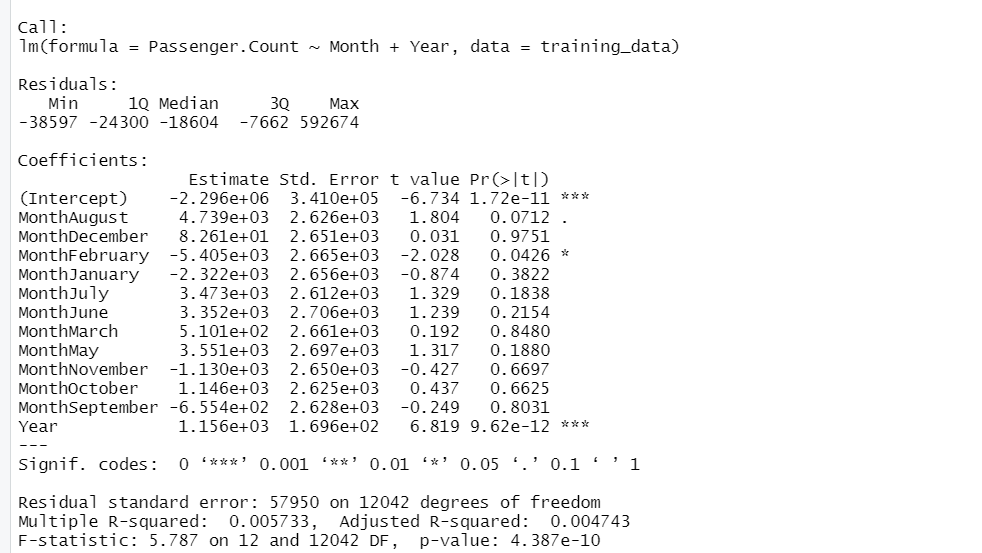
Please make a report (explanation) based on the above output. It shows the output after applying a linear regression model into this dataset : https://drive.google.com/file/d/1XqsEnwsLQ7QN1Q4aD30DIJePmiljr1tL/view?usp=share_link
using this R programming code:
# Load data
data
# Inspect data
str(data)
head(data)
# Check for missing values
sum(is.na(data))
# Summary statistics
summary(data)
# Visualize data
library(ggplot2)
ggplot(data, aes(x = Month, y = Passengers, color = Year)) +
geom_line() +
ggtitle("Air Traffic Passenger Data")
# Splitting data into training and testing sets
library(caTools)
set.seed(123)
split
train_data
test_data
# Model 1: Linear Regression
library(lm)
model1
summary(model1)
Step by Step Solution
There are 3 Steps involved in it

Get step-by-step solutions from verified subject matter experts