

Question: Please Make an excel work sheet solving this question. Please make sure answers are in Excel formulas (and show said excel formulas) Durhlinoton has tracked
 Please Make an excel work sheet solving this question. Please make sure answers are in Excel formulas (and show said excel formulas)
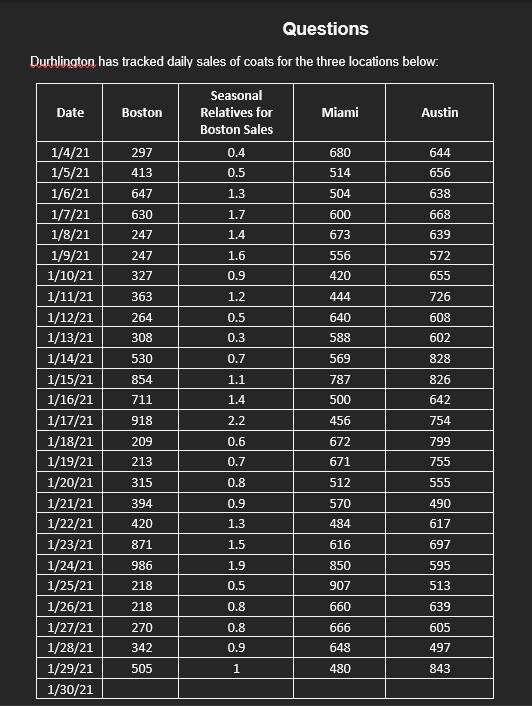
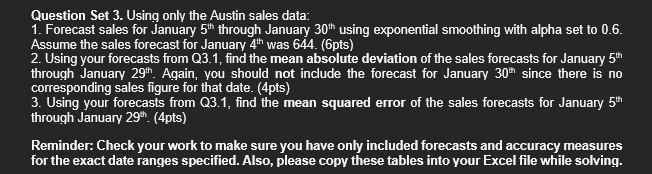
Durhlinoton has tracked dailv sales of coats for the three locations below Question Set 3. Using only the Austin sales data: 1. Forecast sales for January 5th through January 30th using exponential smoothing with alpha set to 0.6 . Assume the sales forecast for January 44h was 644 . ( 6pts) 2. Using your forecasts from Q3.1, find the mean absolute deviation of the sales forecasts for January 5th through January 29th. Again, you should not include the forecast for January 30th since there is no corresponding sales figure for that date. (4pts) 3. Using your forecasts from Q3.1, find the mean squared error of the sales forecasts for January 5th through January 29th. (4pts) Reminder: Check your work to make sure you have only included forecasts and accuracy measures for the exact date ranges specified. Also, please copy these tables into your Excel file while solving
Step by Step Solution
There are 3 Steps involved in it

Get step-by-step solutions from verified subject matter experts