

Question: please make sure draw graph. The following graph shows the daily demand curve for bikes in Ottawa. Use the green rectangle (triangle symbols) to compute

- please make sure draw graph.


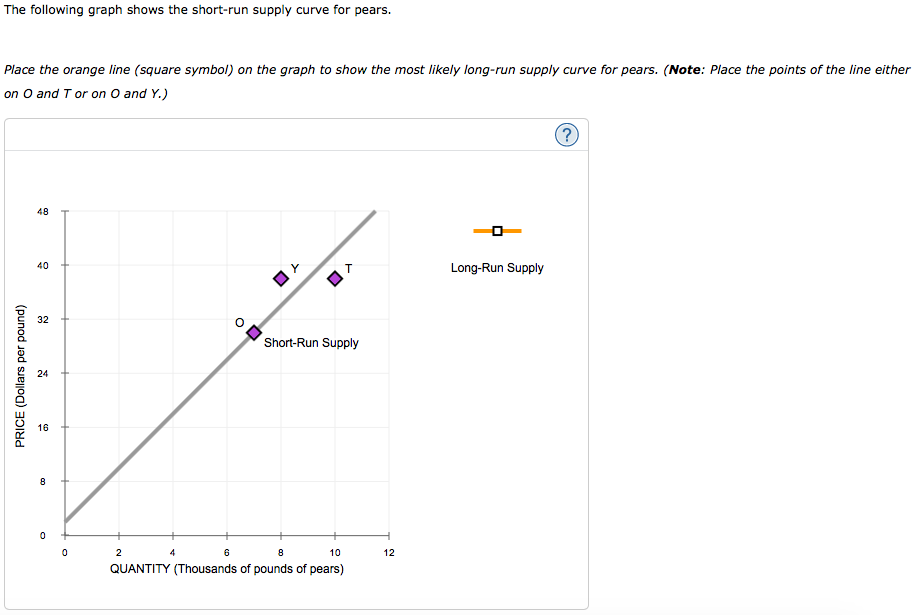
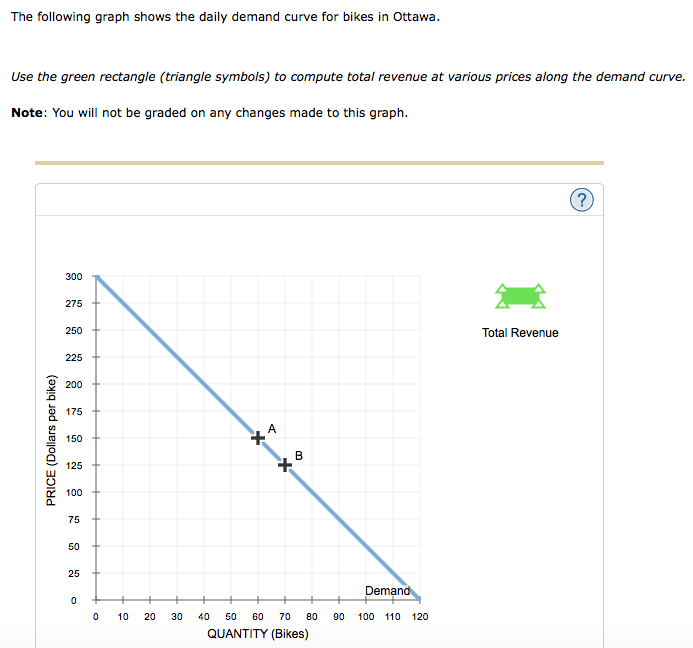
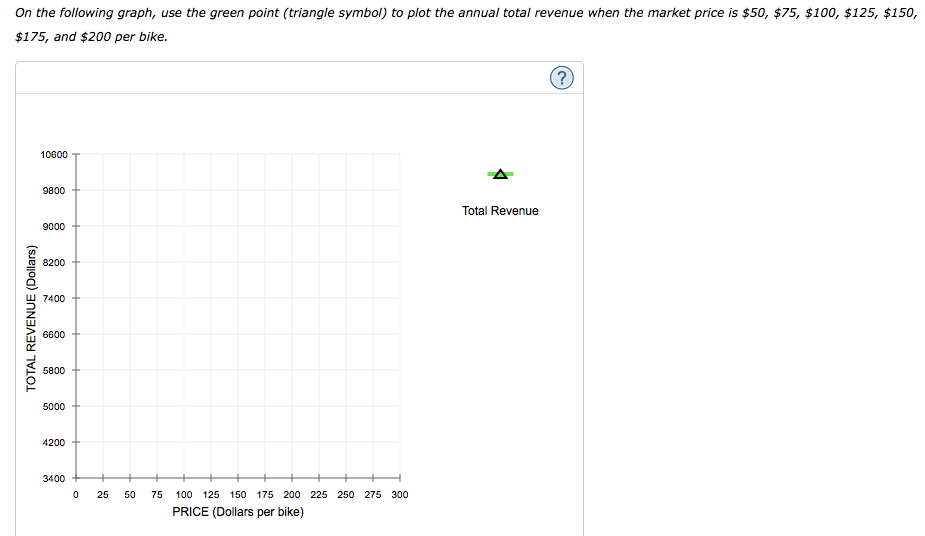
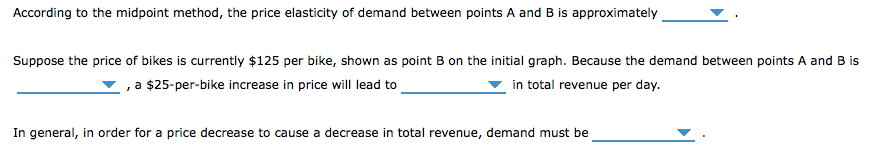
The following graph shows the daily demand curve for bikes in Ottawa. Use the green rectangle (triangle symbols) to compute total revenue at various prices along the demand curve. Note: You will not be graded on any changes made to this graph. (?) 300 275 Total Revenue 250 225 200 175 PRICE (Dollars per bike) 150 125 100 75 50 Demand 10 20 30 40 50 60 70 80 90 100 110 120 0 QUANTITY (Bikes)On the following graph, use the green point (triangle symbol) to plot the annual total revenue when the market price is $50, $75, $100, $125, $150, $175, and $200 per bike. 10600 A 9800 Total Revenue 9000 8200 7400 TOTAL REVENUE (Dollars) 6600 5800 5000 4200 3400 0 25 50 75 100 125 150 175 200 225 250 275 300 PRICE (Dollars per bike)According to the midpoint method, the price elasticity of demand between points A and B is approximately Suppose the price of bikes is currently $125 per bike, shown as point B on the initial graph. Because the demand between points A and B is 7, a $25-per-bike increase in price will lead to in total revenue per day. In general, in order for a price decrease to cause a decrease in total revenue, demand must beThe following graph shows the short-run supply curve for pears. Place the orange line (square symbol) on the graph to show the most likely long-run supply curve for pears. (Note: Place the points of the line either on O and T or on O and Y.) 40 Long-Run Supply 32 Short-Run Supply PRICE (Dollars per pound) 24 16 B 0 2 4 6 10 12 QUANTITY (Thousands of pounds of pears)
Step by Step Solution
There are 3 Steps involved in it

Get step-by-step solutions from verified subject matter experts