

Question: please make sure it is well explained and correct. Newport, Inc. used Excel to run a least-squares regression analysis, which resulted in the following output:
please make sure it is well explained and correct.
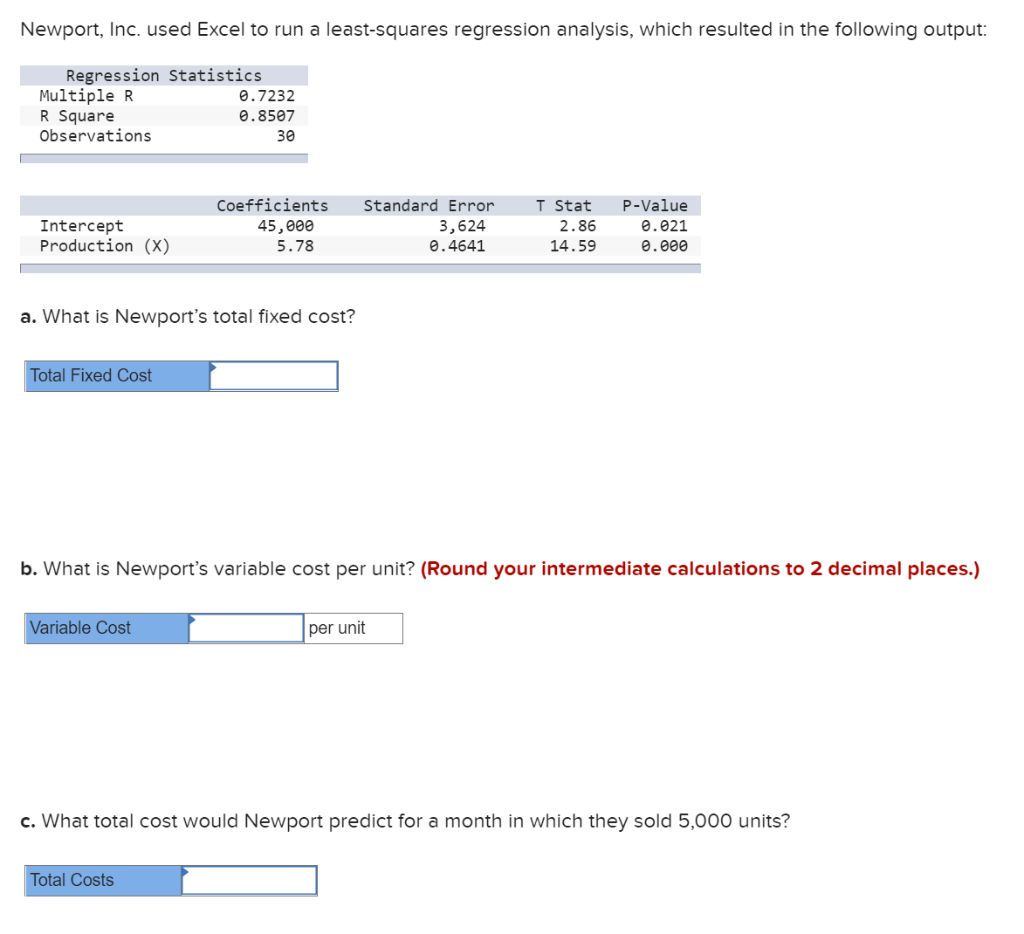
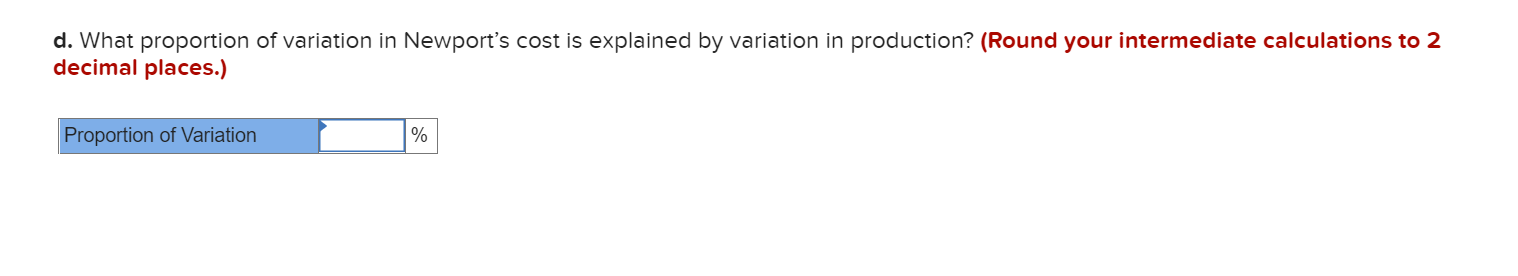
Newport, Inc. used Excel to run a least-squares regression analysis, which resulted in the following output: Regression Statistics Multiple R 0.7232 R Square 0.8507 Observations 30 Intercept Production (x) Coefficients 45,000 5.78 Standard Error 3,624 0.4641 T Stat 2.86 14.59 P-Value 0.021 0.000 a. What is Newport's total fixed cost? Total Fixed Cost b. What is Newport's variable cost per unit? (Round your intermediate calculations to 2 decimal places.) Variable Cost per unit c. What total cost would Newport predict for a month in which they sold 5,000 units? Total Costs d. What proportion of variation in Newport's cost is explained by variation in production? (Round your intermediate calculations to 2 decimal places.) Proportion of Variation %
Step by Step Solution
There are 3 Steps involved in it

Get step-by-step solutions from verified subject matter experts