

Question: **********PLEASE MAKE SURE THAT YOU ANSWER FOR EVERY MONTH NOT JUST JANUARY********* THANK YOU This is all of the information given in the question After
**********PLEASE MAKE SURE THAT YOU ANSWER FOR EVERY MONTH NOT JUST JANUARY********* THANK YOU
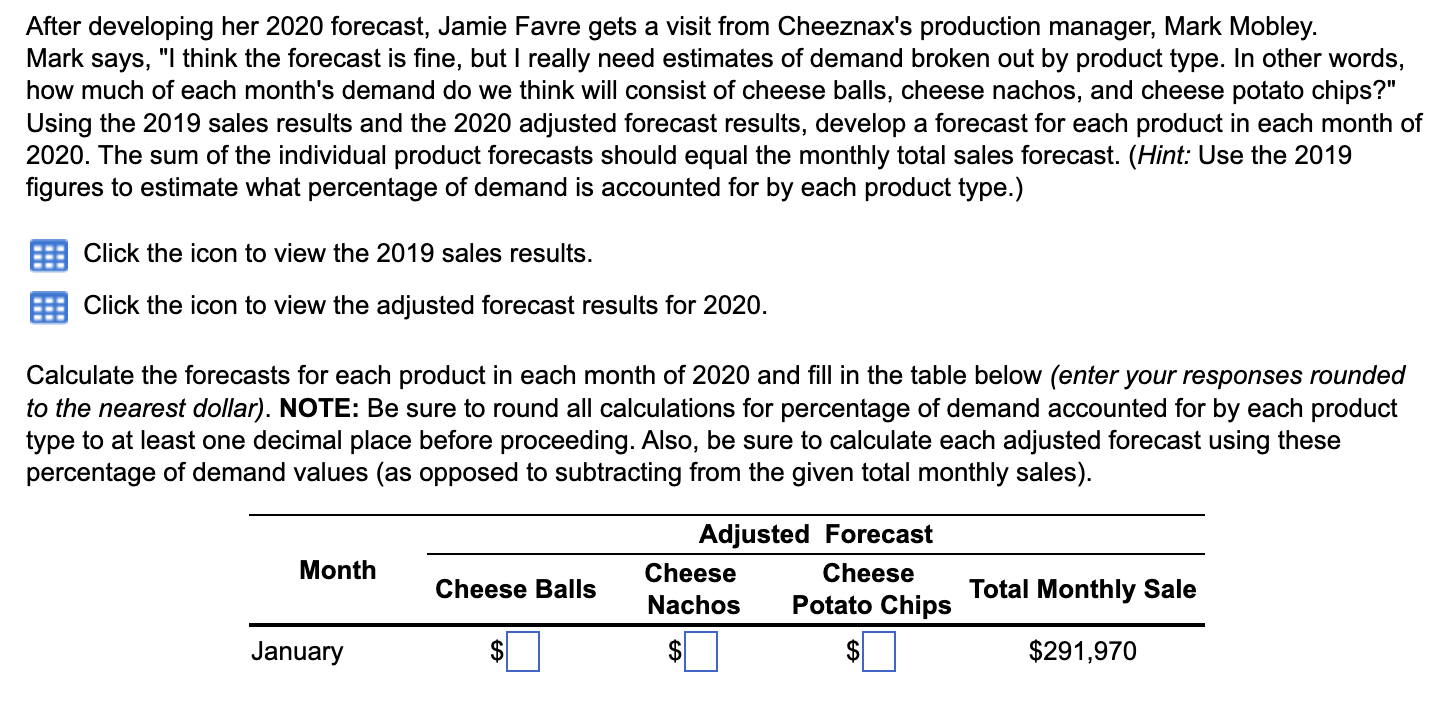
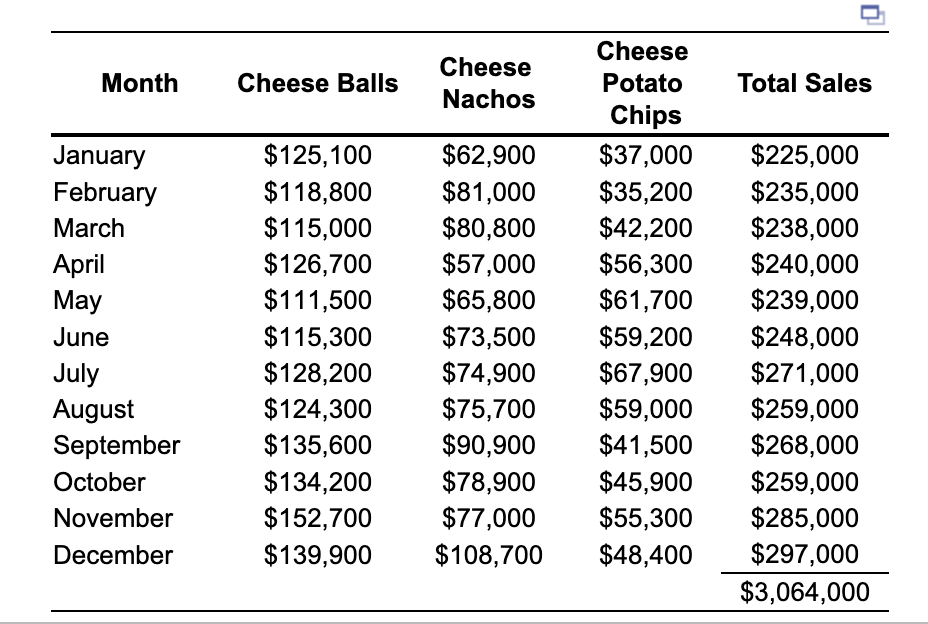
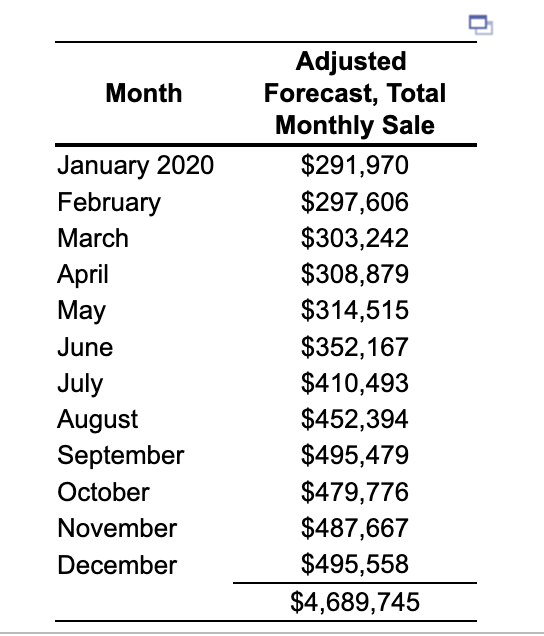
After developing her 2020 forecast, Jamie Favre gets a visit from Cheeznax's production manager, Mark Mobley. Mark says, "I think the forecast is fine, but I really need estimates of demand broken out by product type. In other words, how much of each month's demand do we think will consist of cheese balls, cheese nachos, and cheese potato chips?" Using the 2019 sales results and the 2020 adjusted forecast results, develop a forecast for each product in each month of 2020. The sum of the individual product forecasts should equal the monthly total sales forecast. (Hint: Use the 2019 figures to estimate what percentage of demand is accounted for by each product type.) Click the icon to view the 2019 sales results. Click the icon to view the adjusted forecast results for 2020. Calculate the forecasts for each product in each month of 2020 and fill in the table below (enter your responses rounded to the nearest dollar). NOTE: Be sure to round all calculations for percentage of demand accounted for by each product type to at least one decimal place before proceeding. Also, be sure to calculate each adjusted forecast using these percentage of demand values (as opposed to subtracting from the given total monthly sales). \begin{tabular}{lcccc} \hline \multicolumn{1}{c}{ Month } & Cheese Balls & CheeseNachos & CheesePotatoChips & Total Sales \\ \hline January & $125,100 & $62,900 & $37,000 & $225,000 \\ February & $118,800 & $81,000 & $35,200 & $235,000 \\ March & $115,000 & $80,800 & $42,200 & $238,000 \\ April & $126,700 & $57,000 & $56,300 & $240,000 \\ May & $111,500 & $65,800 & $61,700 & $239,000 \\ June & $115,300 & $73,500 & $59,200 & $248,000 \\ July & $128,200 & $74,900 & $67,900 & $271,000 \\ August & $124,300 & $75,700 & $59,000 & $259,000 \\ September & $135,600 & $90,900 & $41,500 & $268,000 \\ October & $134,200 & $78,900 & $45,900 & $259,000 \\ November & $152,700 & $77,000 & $55,300 & $285,000 \\ December & $139,900 & $108,700 & $48,400 & $297,000 \\ \hline \end{tabular} \begin{tabular}{lc} \hline \multicolumn{1}{c}{ Month } & AdjustedForecast,TotalMonthlySale \\ \hline January 2020 & $291,970 \\ February & $297,606 \\ March & $303,242 \\ April & $308,879 \\ May & $314,515 \\ June & $352,167 \\ July & $410,493 \\ August & $452,394 \\ September & $495,479 \\ October & $479,776 \\ November & $487,667 \\ December & $495,558 \\ \cline { 2 - 2 } & $4,689,745 \\ \hline \end{tabular}
Step by Step Solution
There are 3 Steps involved in it

Get step-by-step solutions from verified subject matter experts