

Question: Please make sure the answer is correct. Thank you very much 7 Review Later Identify all the sell signals based on the share price and
 Please make sure the answer is correct. Thank you very much
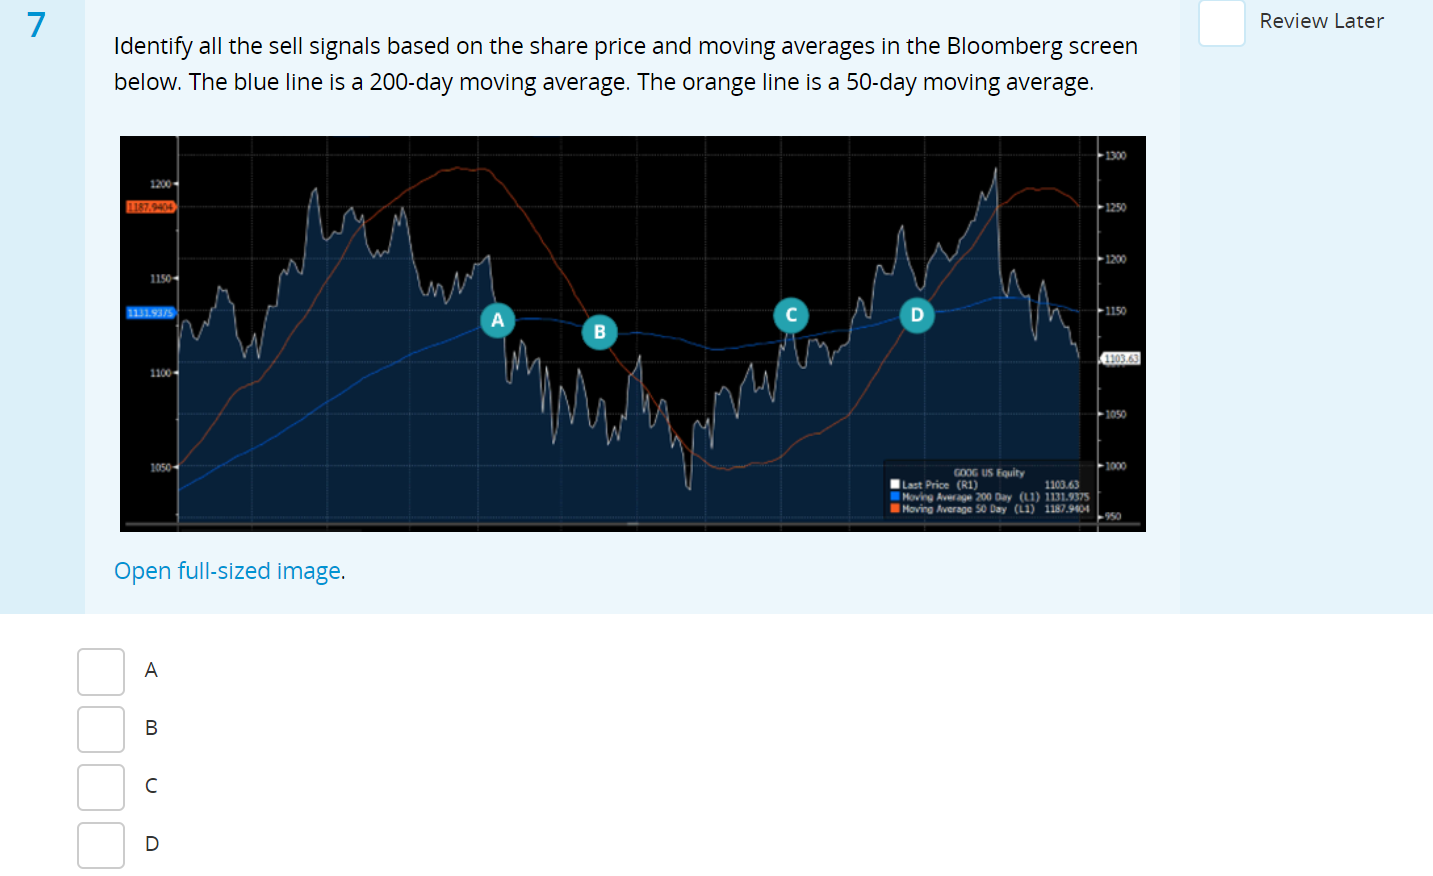
7 Review Later Identify all the sell signals based on the share price and moving averages in the Bloomberg screen below. The blue line is a 200-day moving average. The orange line is a 50-day moving average. 1300 1200- 1187.9404 1250 1200 1150 muy 11319375 D 1150 B 1103.63 11004 1050 1050 >1000 GOOG US Equity Last Price (R1) 1103.63 Moving Average 200 Day (LI) 1131.9375 Moving Average So Day (LI) 1187.9004 950 Open full-sized image. A B D
Step by Step Solution
There are 3 Steps involved in it
1 Expert Approved Answer
Step: 1 Unlock

Question Has Been Solved by an Expert!
Get step-by-step solutions from verified subject matter experts
Step: 2 Unlock
Step: 3 Unlock