

Question: Please make sure to include the Excel output screenshot using the data in the last picture. Thank you! Currentprices.com keeps a record of the sales
Please make sure to include the Excel output screenshot using the data in the last picture. Thank you!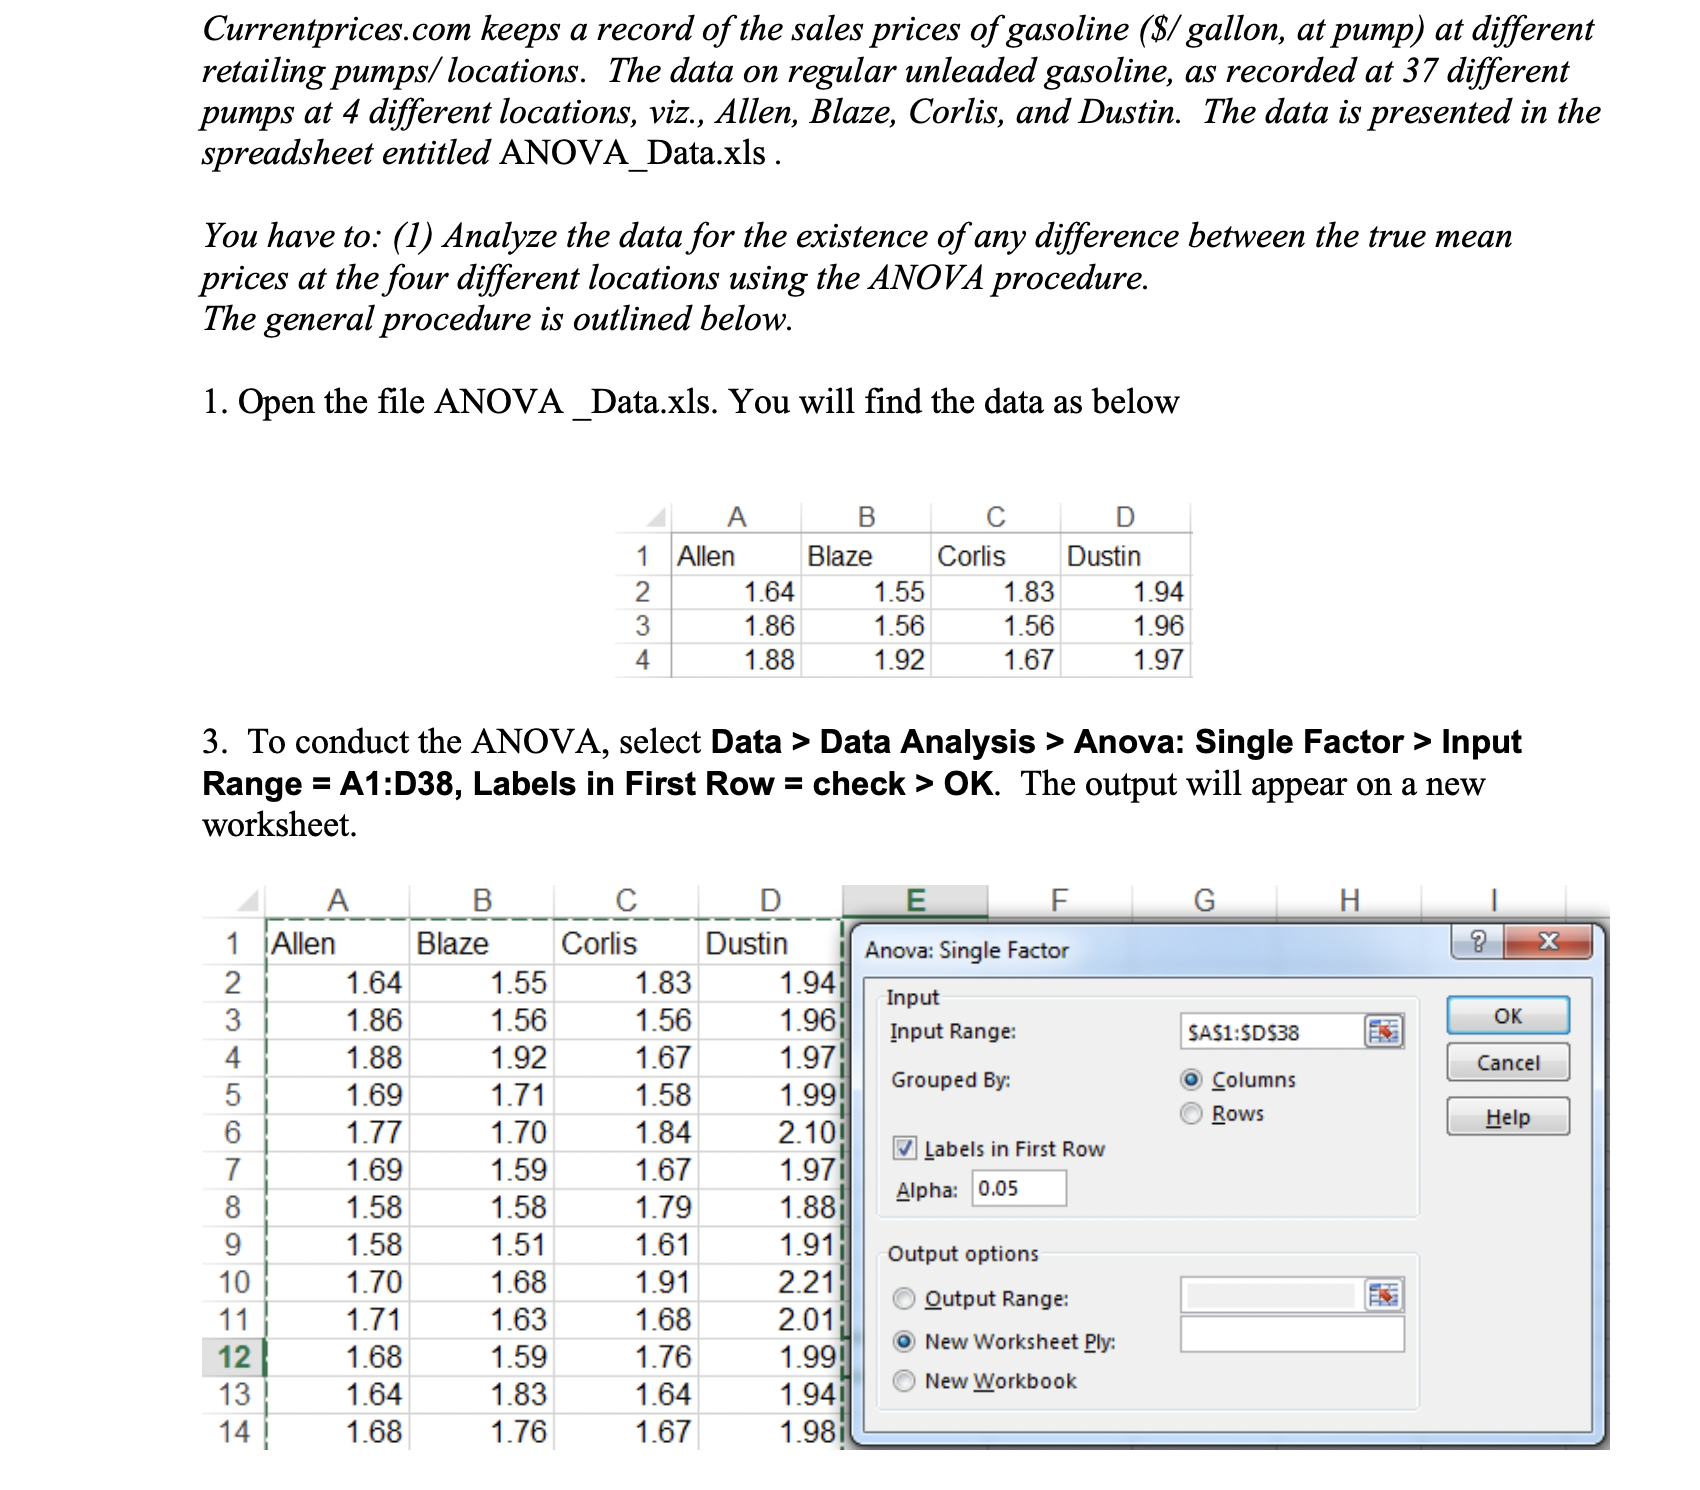
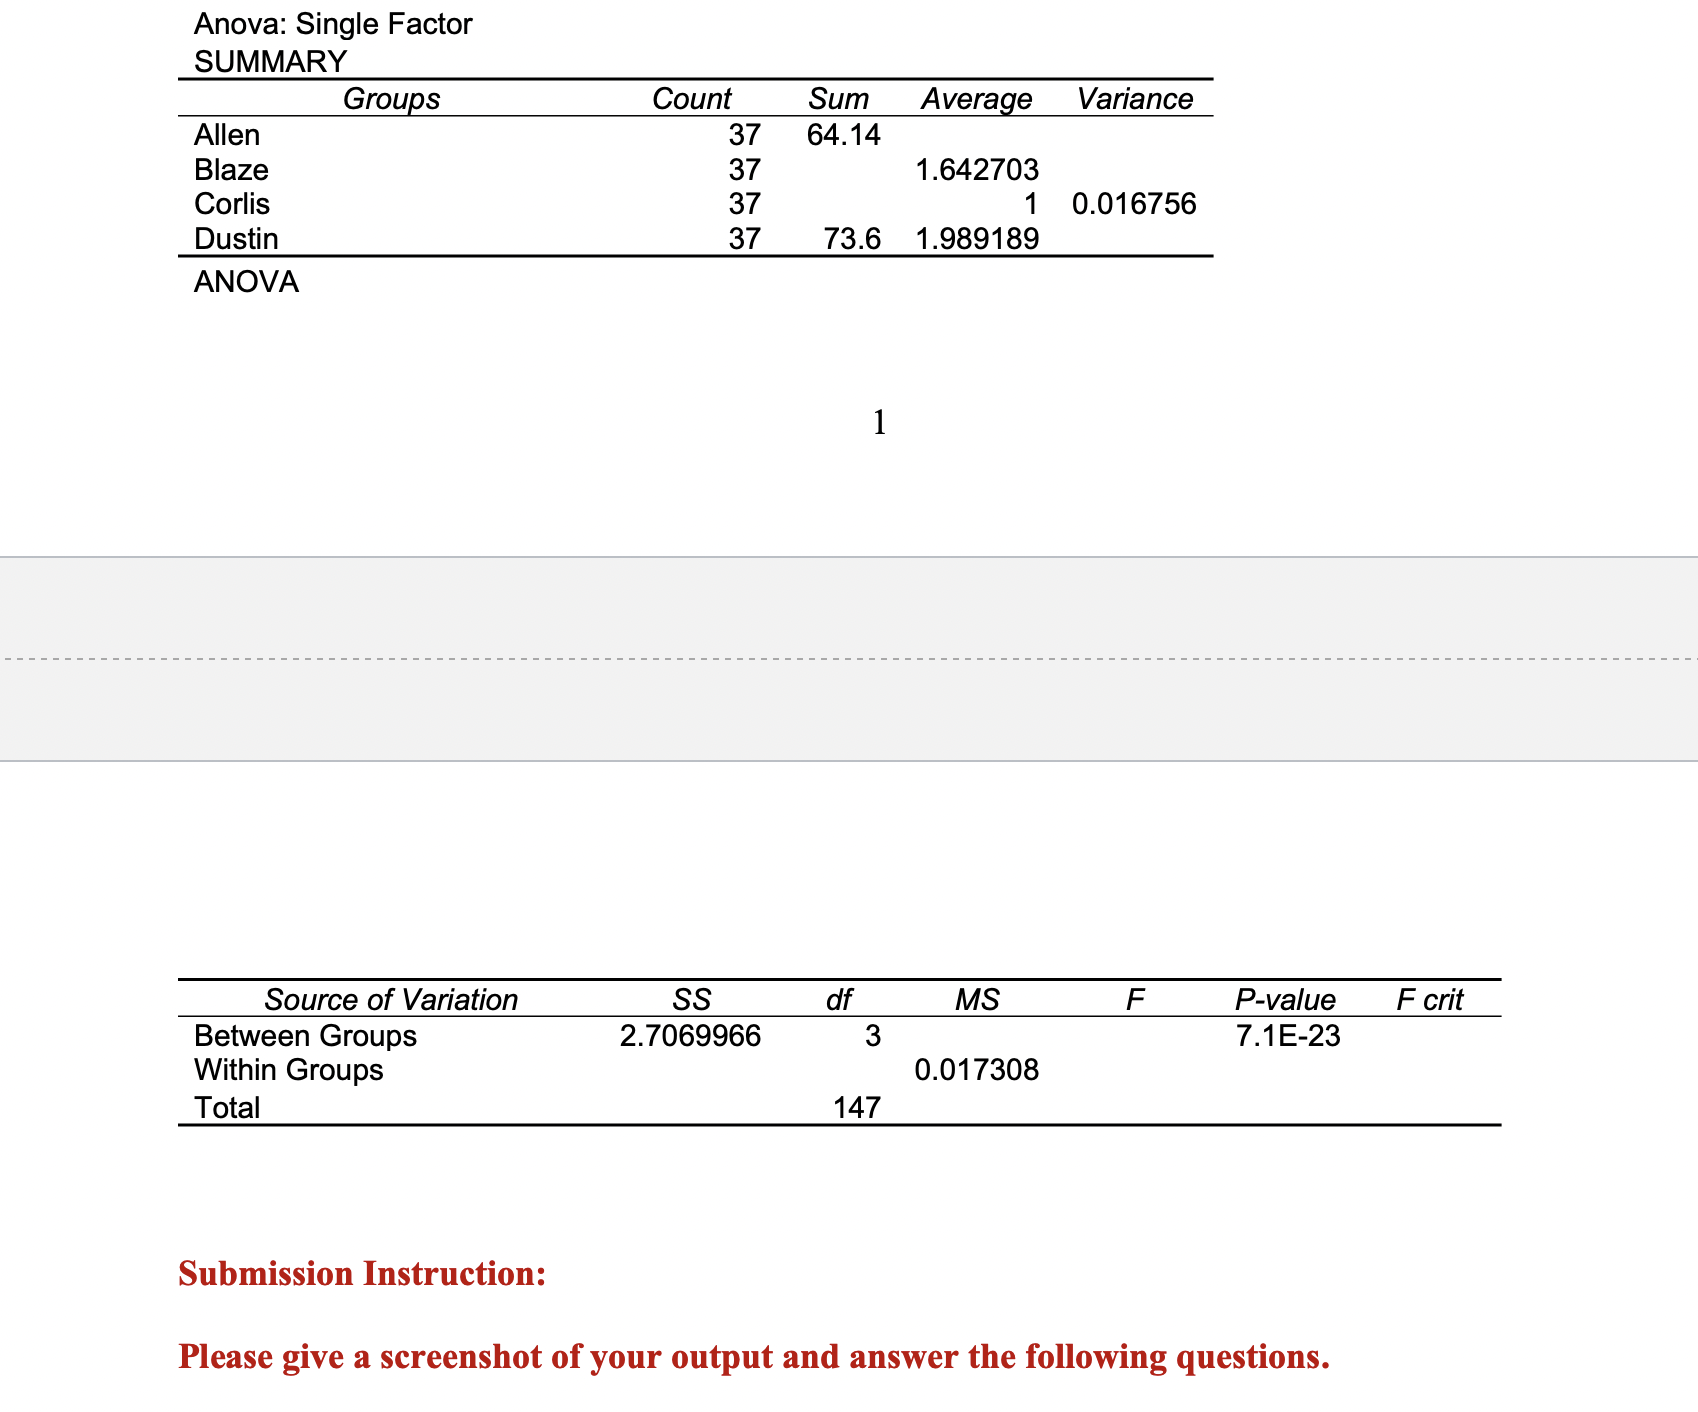
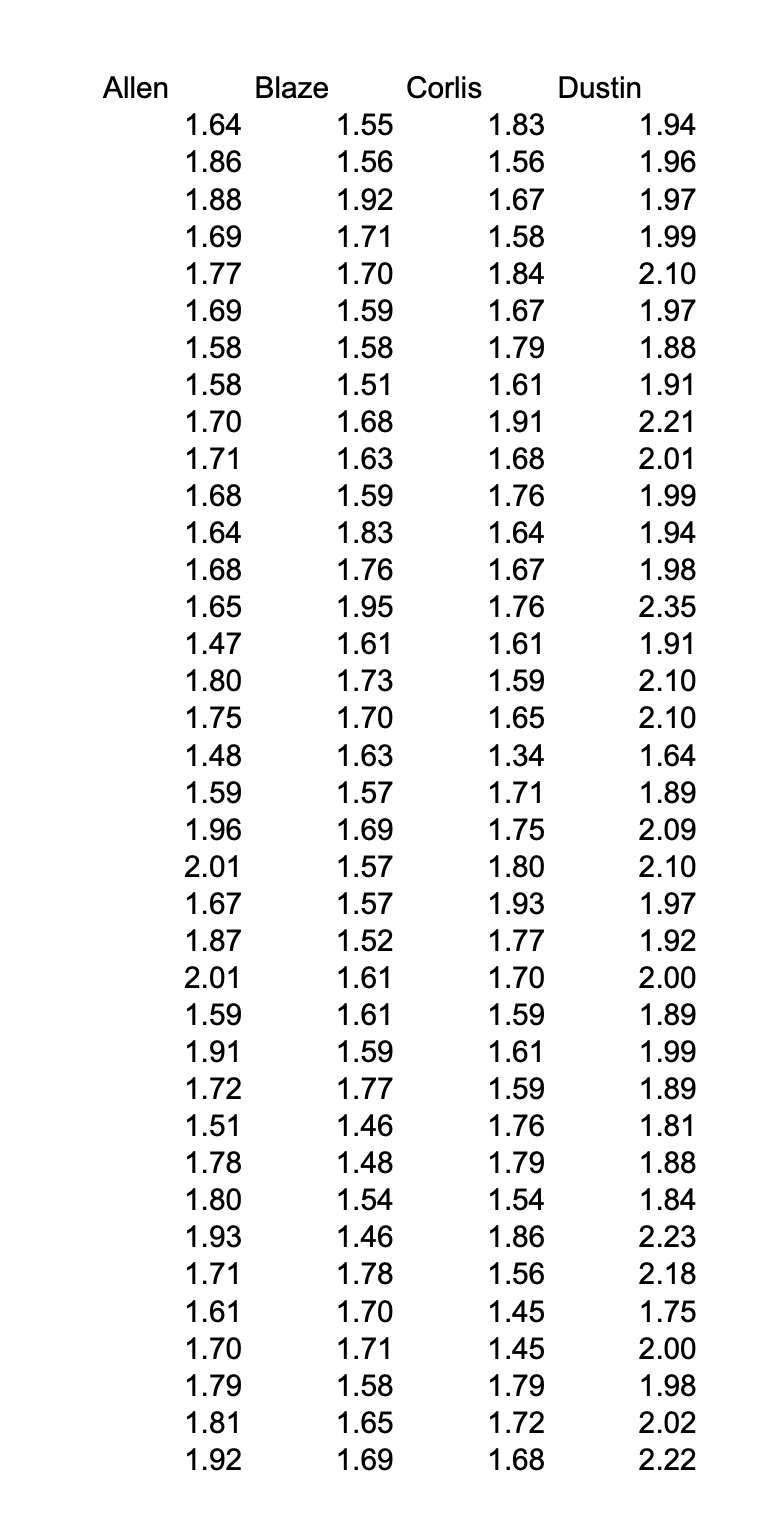
Currentprices.com keeps a record of the sales prices of gasoline (\$/ gallon, at pump) at different retailing pumps/locations. The data on regular unleaded gasoline, as recorded at 37 different pumps at 4 different locations, viz., Allen, Blaze, Corlis, and Dustin. The data is presented in the spreadsheet entitled ANOVA_Data.xls . You have to: (1) Analyze the data for the existence of any difference between the true mean prices at the four different locations using the ANOVA procedure. The general procedure is outlined below. 1. Open the file ANOVA_Data.xls. You will find the data as below 3. To conduct the ANOVA, select Data > Data Analysis > Anova: Single Factor > Input Range = A1:D38, Labels in First Row = check > OK. The output will appear on a new worksheet. Anova: Single Factor SI IMMARY 1 Submission Instruction: Please give a screenshot of your output and answer the following questions. \begin{tabular}{cccc} Allen & \multicolumn{2}{c}{ Blaze Corlis } & \multicolumn{2}{c}{ Dustin } \\ 1.64 & 1.55 & 1.83 & 1.94 \\ 1.86 & 1.56 & 1.56 & 1.96 \\ 1.88 & 1.92 & 1.67 & 1.97 \\ 1.69 & 1.71 & 1.58 & 1.99 \\ 1.77 & 1.70 & 1.84 & 2.10 \\ 1.69 & 1.59 & 1.67 & 1.97 \\ 1.58 & 1.58 & 1.79 & 1.88 \\ 1.58 & 1.51 & 1.61 & 1.91 \\ 1.70 & 1.68 & 1.91 & 2.21 \\ 1.71 & 1.63 & 1.68 & 2.01 \\ 1.68 & 1.59 & 1.76 & 1.99 \\ 1.64 & 1.83 & 1.64 & 1.94 \\ 1.68 & 1.76 & 1.67 & 1.98 \\ 1.65 & 1.95 & 1.76 & 2.35 \\ 1.47 & 1.61 & 1.61 & 1.91 \\ 1.80 & 1.73 & 1.59 & 2.10 \\ 1.75 & 1.70 & 1.65 & 2.10 \\ 1.48 & 1.63 & 1.34 & 1.64 \\ 1.59 & 1.57 & 1.71 & 1.89 \\ 1.96 & 1.69 & 1.75 & 2.09 \\ 2.01 & 1.57 & 1.80 & 2.10 \\ 1.67 & 1.57 & 1.93 & 1.97 \\ 1.87 & 1.52 & 1.77 & 1.92 \\ 2.01 & 1.61 & 1.70 & 2.00 \\ 1.59 & 1.61 & 1.59 & 1.89 \\ 1.91 & 1.59 & 1.61 & 1.99 \\ 1.72 & 1.77 & 1.59 & 1.89 \\ 1.51 & 1.46 & 1.76 & 1.81 \\ 1.78 & 1.48 & 1.79 & 1.88 \\ 1.80 & 1.54 & 1.54 & 1.84 \\ 1.93 & 1.46 & 1.86 & 2.23 \\ 1.71 & 1.78 & 1.56 & 2.18 \\ 1.61 & 1.70 & 1.45 & 1.75 \\ 1.70 & 1.71 & 1.45 & 2.00 \\ 1.79 & 1.58 & 1.79 & 1.98 \\ 1.81 & 1.65 & 1.72 & 2.02 \\ 1.92 & 1.69 & 1.68 & 2.22 \\ & & & \end{tabular}
Step by Step Solution
There are 3 Steps involved in it

Get step-by-step solutions from verified subject matter experts