

Question: please make sure to post so answer is visible and not cut off In the previous attempt. Simon Company's year-end balance sheets follow. 2018 2017
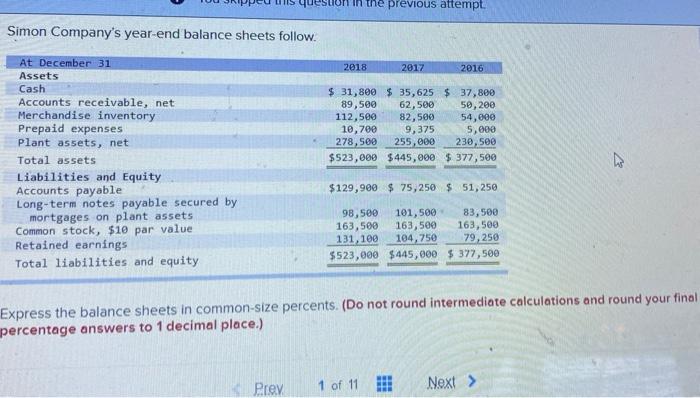
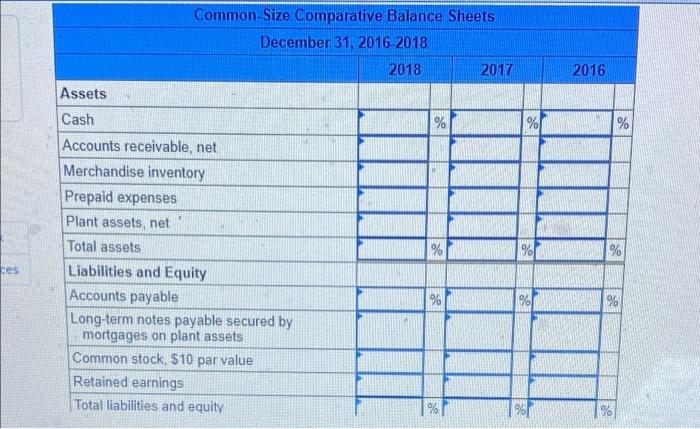
In the previous attempt. Simon Company's year-end balance sheets follow. 2018 2017 2016 $ 31,800 $ 35,625 $ 37,800 89,500 62,500 50,200 112,500 82,500 54,000 10,700 9,375 5,000 278,500 255,000 230, 500 $523,000 $445,000 $ 377,500 At December 31 Assets Cash Accounts receivable, net Merchandise inventory Prepaid expenses Plant assets, net Total assets Liabilities and Equity Accounts payable Long-term notes payable secured mortgages on plant assets Common stock, $10 par value Retained earnings Total liabilities and equity $129,900 $ 75,250 $ 51,250 98,500 101,500 83,500 163,500 163,500 163,500 131, 100 104,750 79,250 $523,000 $445,000 $ 377,500 Express the balance sheets in common-size percents. (Do not round intermediate calculations and round your final percentage answers to 1 decimal place.) Prey 1 of 11 HI! Next > 2016 % % Common-Size Comparative Balance Sheets December 31, 2016 2018 2018 2017 Assets Cash % Accounts receivable, net Merchandise inventory Prepaid expenses Plant assets, net Total assets Liabilities and Equity Accounts payable % Long-term notes payable secured by mortgages on plant assets Common stock $10 par value Retained earnings Total liabilities and equity % % les 1% %
Step by Step Solution
There are 3 Steps involved in it

Get step-by-step solutions from verified subject matter experts