

Question: Please make the same assignment on another company. this assignment is on apple company please make on another company Note: i Need same assignment on
Please make the same assignment on another company. this assignment is on apple company please make on another company
Note: i Need same assignment on another company.
 ..
..
Please make the same assignment on another company. this assignment is on apple company please make on another company
Note: i Need same assignment on another company.
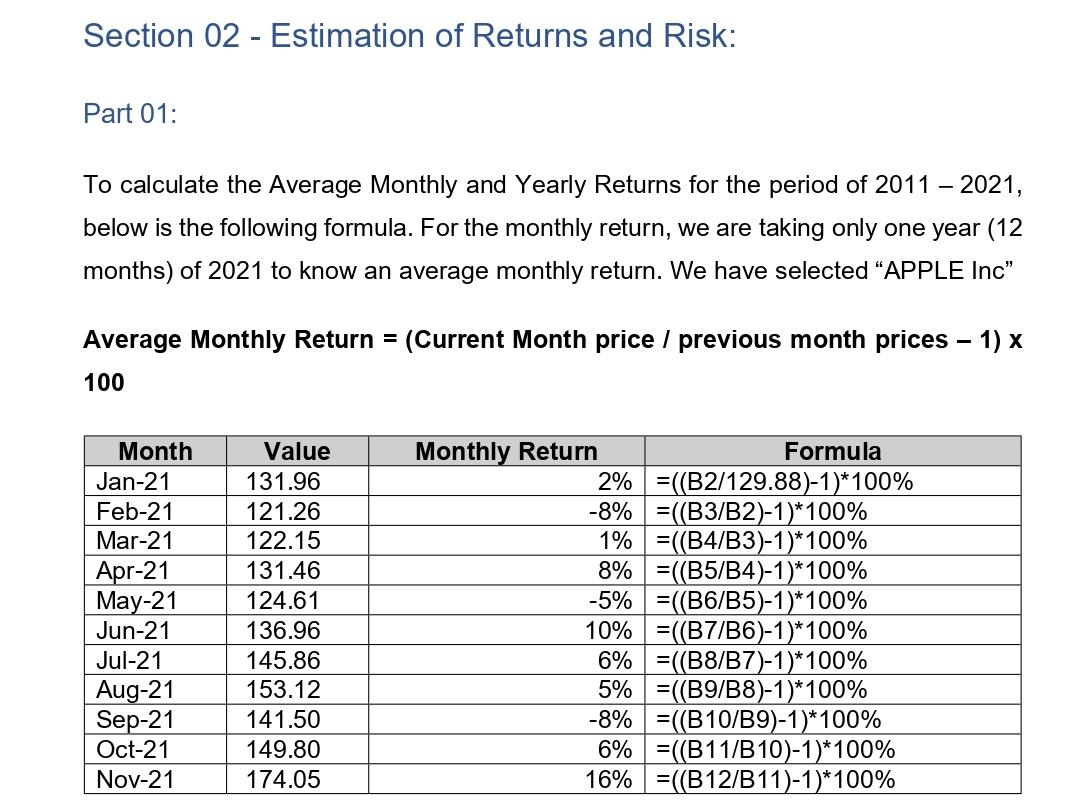
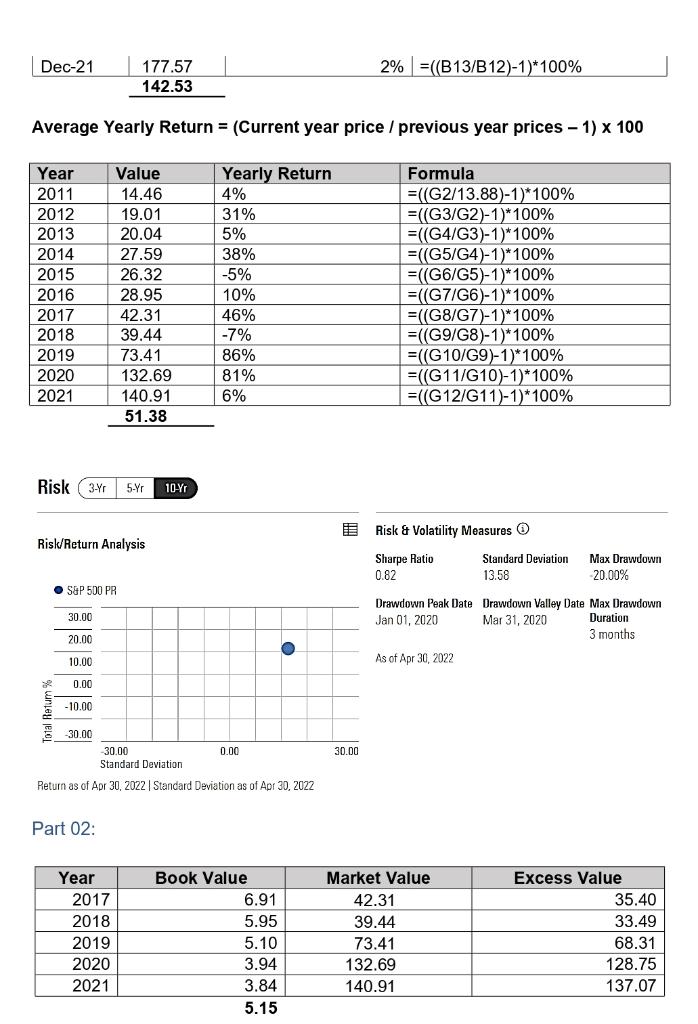
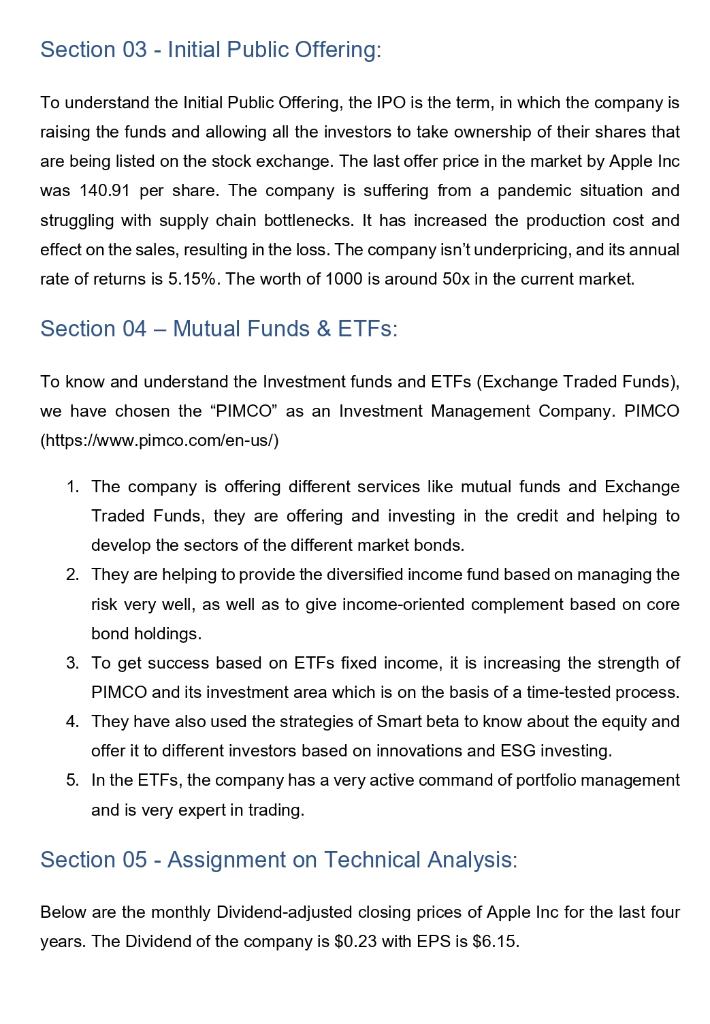
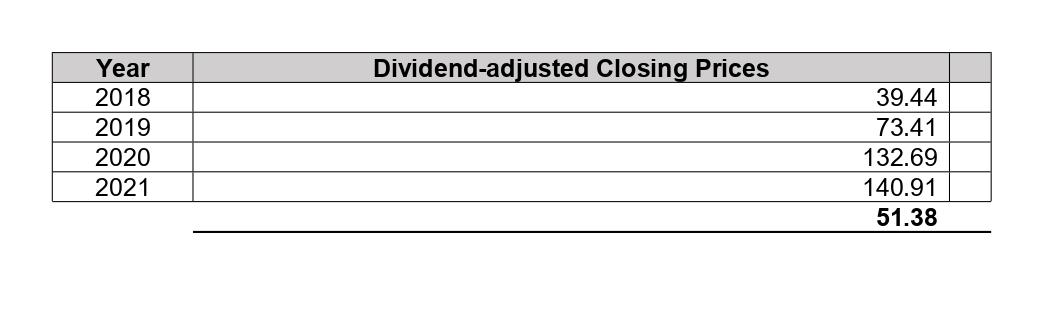
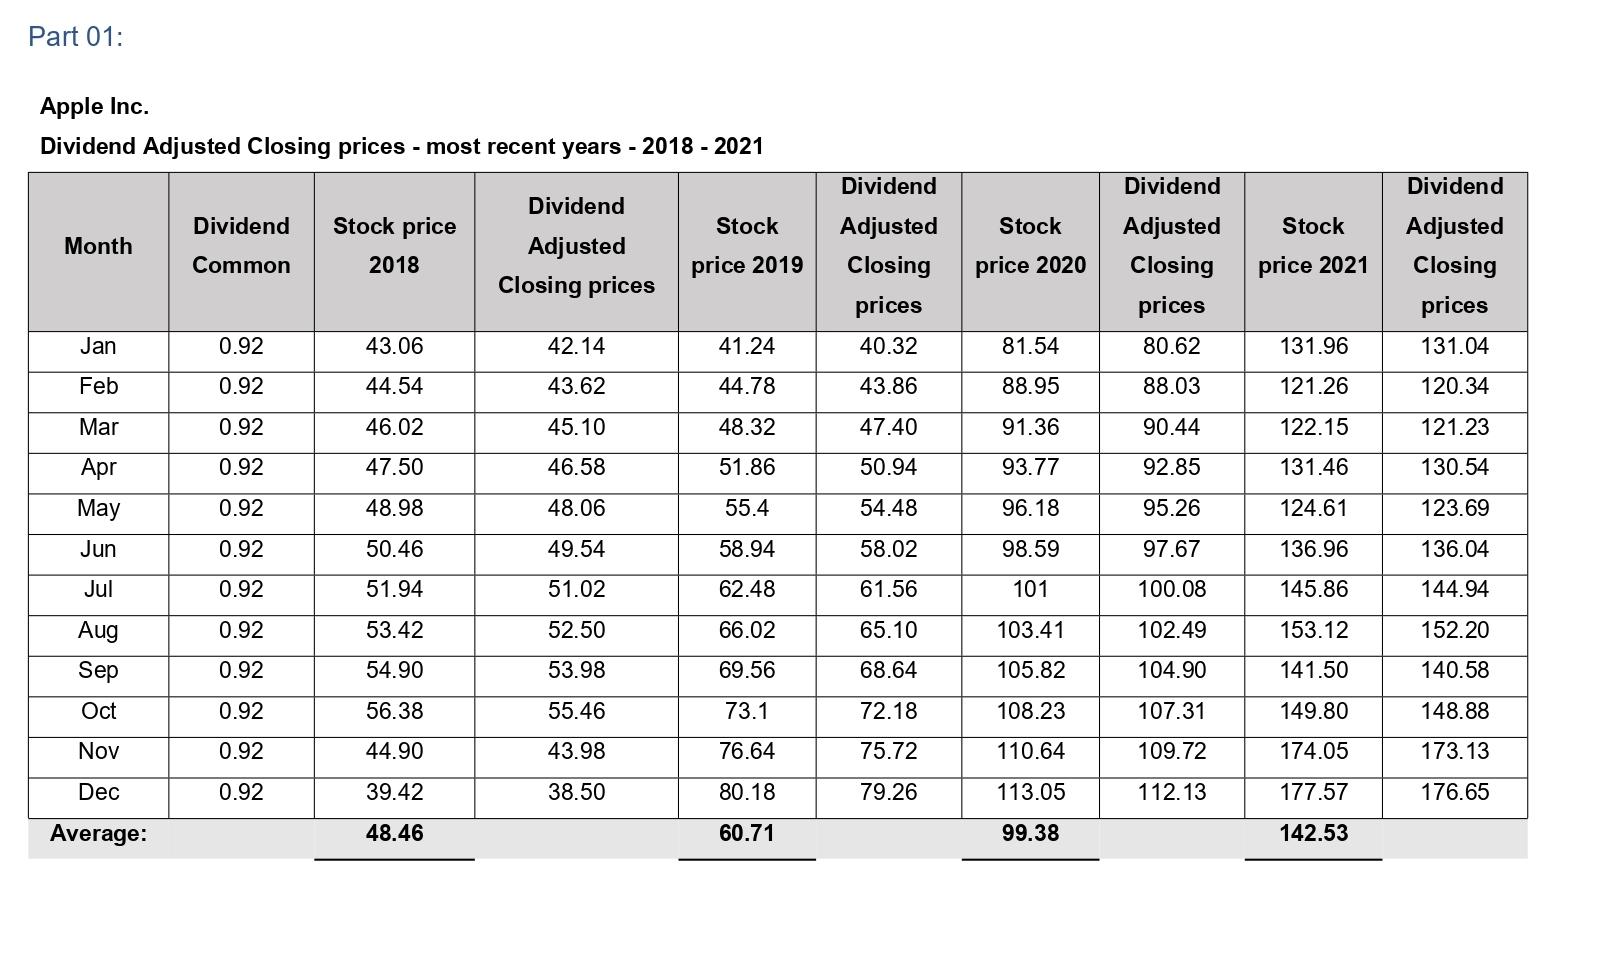
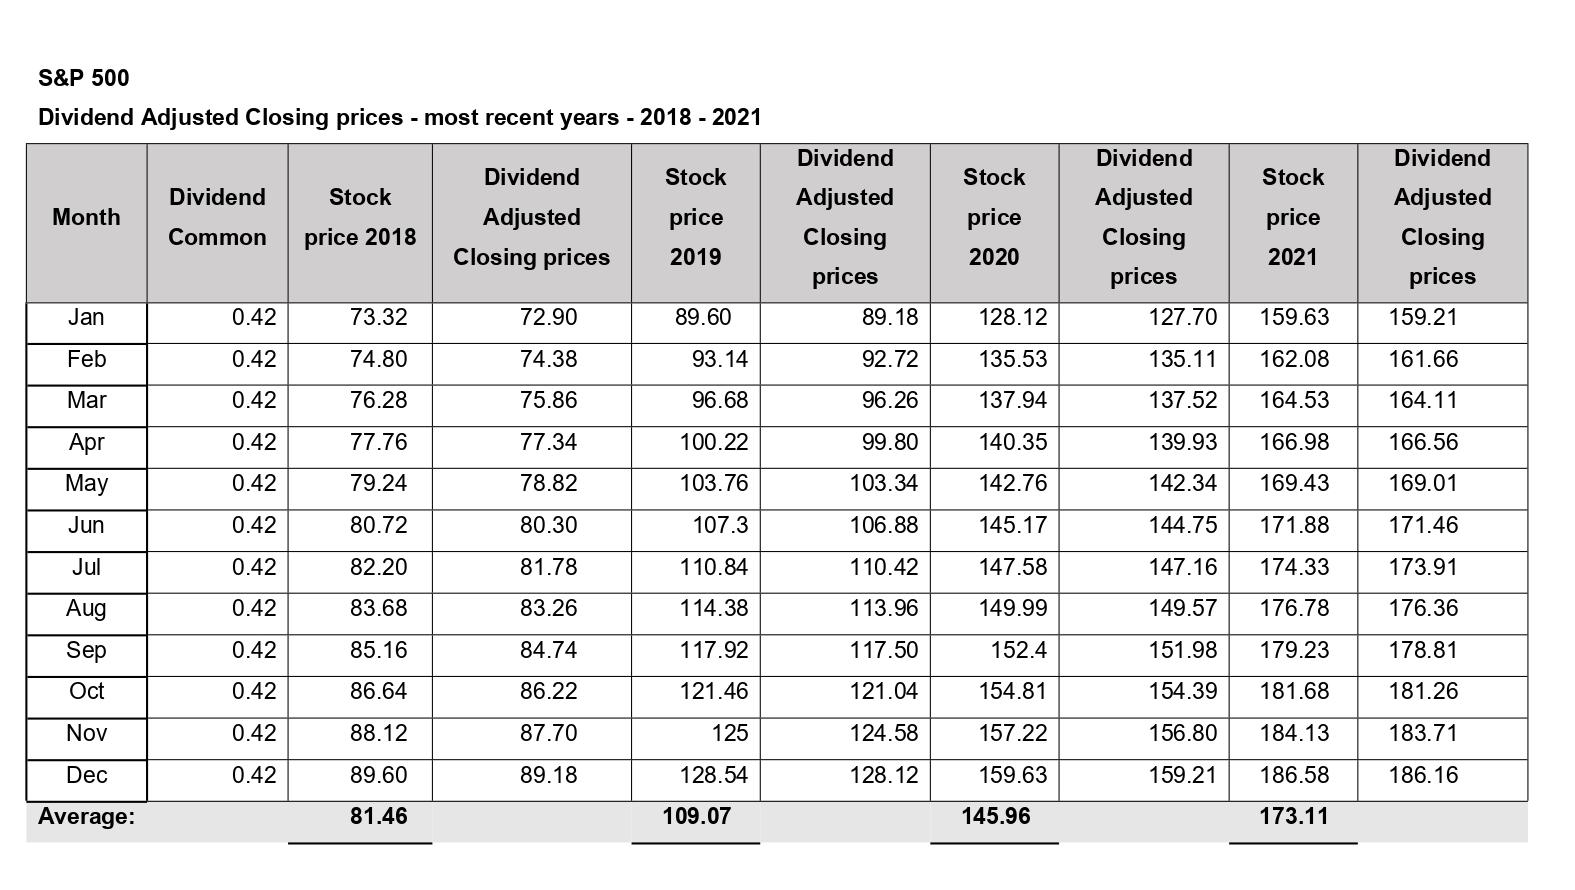
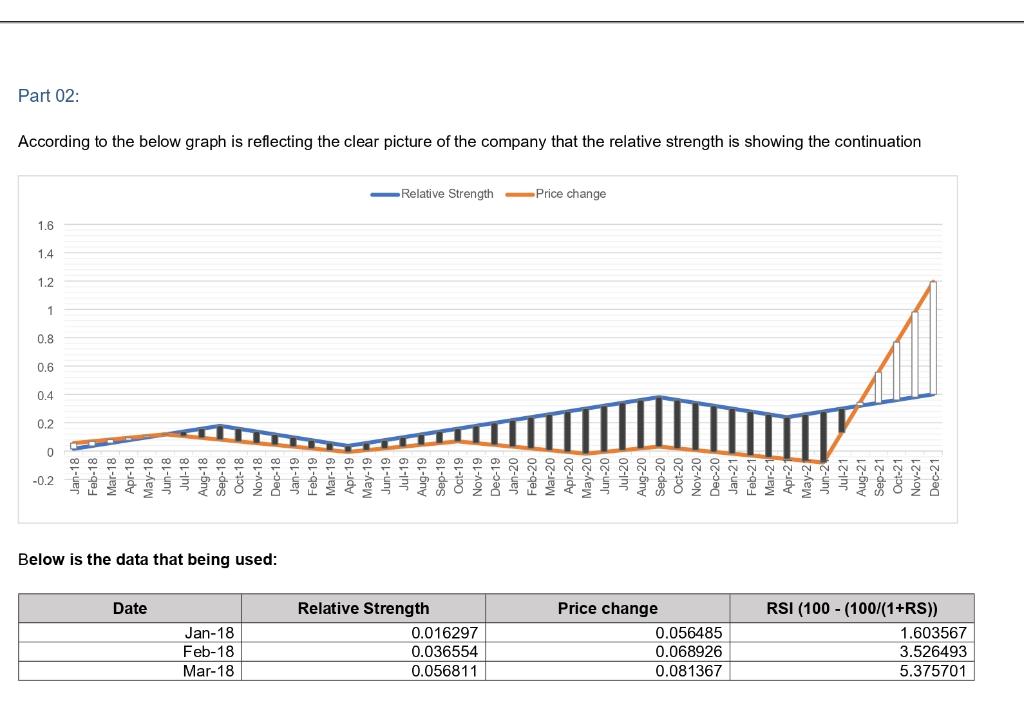
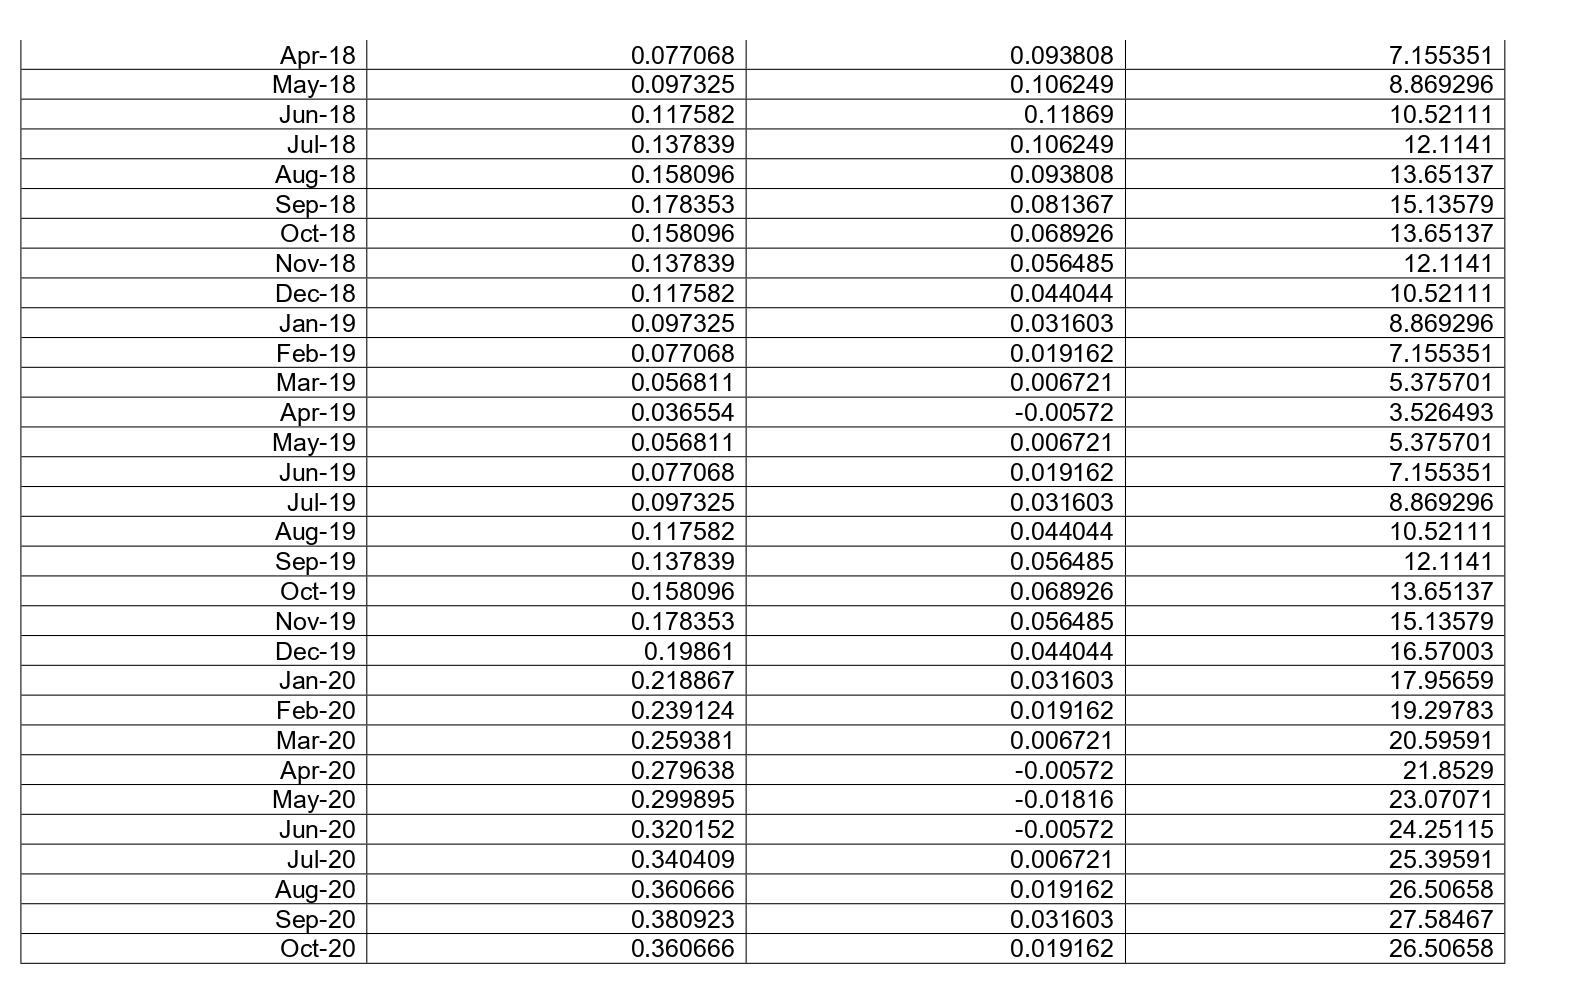
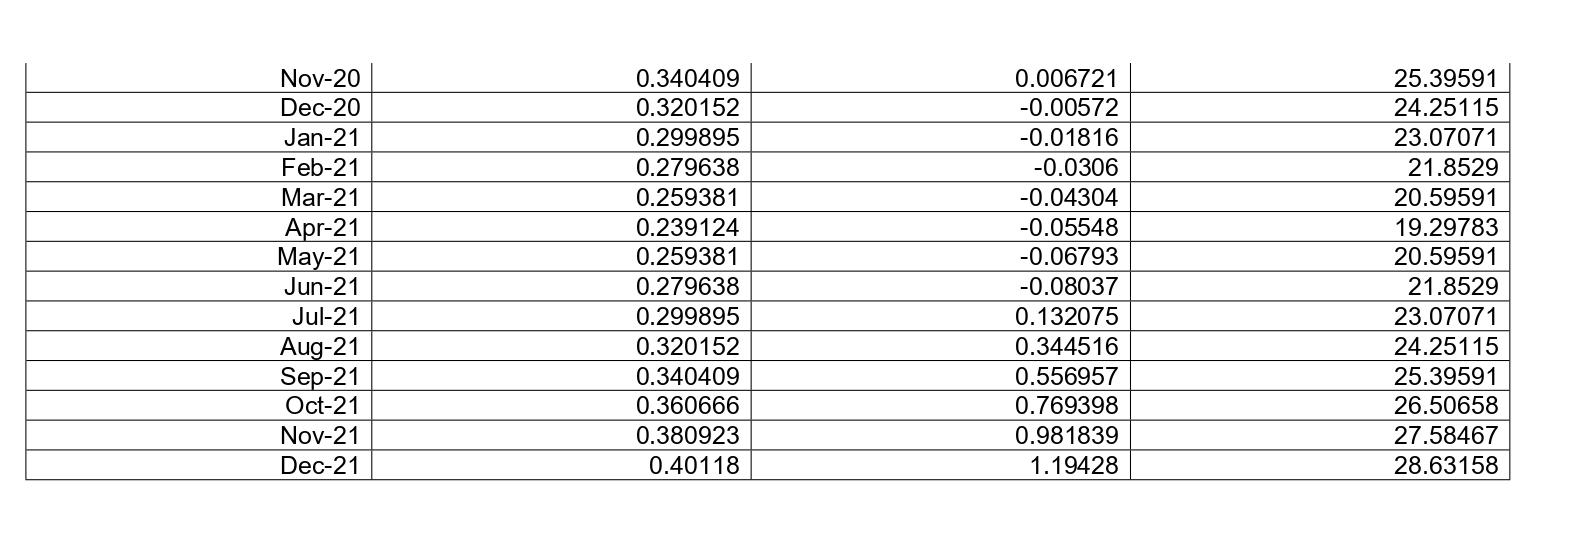
Section 02 - Estimation of Returns and Risk: Part 01: To calculate the Average Monthly and Yearly Returns for the period of 2011 - 2021, below is the following formula. For the monthly return, we are taking only one year (12 months) of 2021 to know an average monthly return. We have selected "APPLE Inc" Average Monthly Return = (Current Month price / previous month prices - 1) x 100 Month Value Monthly Return Formula 2% ((B2/129.88)-1)*100% -8% =((B3/B2)-1)*100% 1% =((B4/B3)-1)* 100% 8% =((B5/B4)-1)* 100% =((B6/B5)-1)* 100% -5% 10% =((B7/B6)-1)* 100% 6% ((B8/B7)-1)*100% 5% ((B9/B8)-1)* 100% -8% =((B10/B9)-1)*100% 6% ((B11/B10)-1)*100% 16% =((B12/B11)-1)*100% Jan-21 Feb-21 Mar-21 Apr-21 May-21 Jun-21 Jul-21 Aug-21 Sep-21 Oct-21 Nov-21 131.96 121.26 122.15 131.46 124.61 136.96 145.86 153.12 141.50 149.80 174.05 Dec-21 2% ((B13/B12)-1)*100% 177.57 142.53 Average Yearly Return = (Current year price / previous year prices - 1) x 100 Year Value Yearly Return Formula 2011 14.46 4% 2012 19.01 31% =((G2/13.88)-1)* 100% =((G3/G2)-1)* 100% =((G4/G3)-1)* 100% =((G5/G4)-1)* 100% 2013 20.04 5% 2014 27.59 38% 2015 26.32 -5% =((G6/G5)-1)*100% 2016 28.95 10% =((G7/G6)-1)* 100% 2017 42.31 46% 2018 39.44 -7% =((G8/G7)-1)*100% =((G9/G8)-1)* 100% =((G10/G9)-1)*100% 2019 73.41 86% 2020 132.69 81% =((G11/G10)-1)*100% =((G12/G11)-1)* 100% 2021 140.91 6% 51.38 Risk (3-Yr 5-Yr 10-Yr Risk/Return Analysis S&P 500 PR 30.00 20.00 10.00 0.00 -10.00 -30.00 -30.00 0.00 Standard Deviation Return as of Apr 30, 2022 | Standard Deviation as of Apr 30, 2022 Part 02: Year Book Value 2017 2018 2019 2020 2021 6.91 5.95 5.10 3.94 3.84 5.15 O 30.00 Risk & Volatility Measures Sharpe Ratio 0.82 Standard Deviation 13.58 Max Drawdown -20.00% Drawdown Peak Date Drawdown Valley Date Max Drawdown Jan 01, 2020 Mar 31, 2020 Duration 3 months As of Apr 30, 2022 Market Value 42.31 39.44 73.41 132.69 140.91 Excess Value 35.40 33.49 68.31 128.75 137.07 Section 03- Initial Public Offering: To understand the Initial Public Offering, the IPO is the term, in which the company is raising the funds and allowing all the investors to take ownership of their shares that are being listed on the stock exchange. The last offer price in the market by Apple Inc was 140.91 per share. The company is suffering from a pandemic situation and struggling with supply chain bottlenecks. It has increased the production cost and effect on the sales, resulting in the loss. The company isn't underpricing, and its annual rate of returns is 5.15%. The worth of 1000 is around 50x in the current market. Section 04- Mutual Funds & ETFs: To know and understand the Investment funds and ETFs (Exchange Traded Funds), we have chosen the "PIMCO" as an Investment Management Company. PIMCO (https://www.pimco.com/en-us/) 1. The company is offering different services like mutual funds and Exchange Traded Funds, they are offering and investing in the credit and helping to develop the sectors of the different market bonds. 2. They are helping to provide the diversified income fund based on managing the risk very well, as well as to give income-oriented complement based on core bond holdings. 3. To get success based on ETFs fixed income, it is increasing the strength of PIMCO and its investment area which is on the basis of a time-tested process. 4. They have also used the strategies of Smart beta to know about the equity and offer it to different investors based on innovations and ESG investing. 5. In the ETFs, the company has a very active command of portfolio management and is very expert in trading. Section 05- Assignment on Technical Analysis: Below are the monthly Dividend-adjusted closing prices of Apple Inc for the last four years. The Dividend of the company is $0.23 with EPS is $6.15. Year 2018 2019 2020 2021 Dividend-adjusted Closing Prices 39.44 73.41 132.69 140.91 51.38 Part 01: Apple Inc. Dividend Adjusted Closing prices - most recent years - 2018 - 2021 Dividend Month Dividend Common Stock price 2018 Adjusted Stock price 2019 Closing prices Jan 0.92 43.06 42.14 41.24 Feb 0.92 44.54 43.62 44.78 Mar 0.92 46.02 45.10 48.32 Apr 0.92 47.50 46.58 51.86 May 0.92 48.98 48.06 55.4 Jun 0.92 50.46 49.54 58.94 Jul 0.92 51.94 51.02 62.48 Aug 0.92 53.42 52.50 66.02 Sep 0.92 54.90 53.98 69.56 Oct 0.92 56.38 55.46 73.1 Nov 0.92 44.90 43.98 76.64 Dec 0.92 39.42 38.50 80.18 Average: 48.46 60.71 Dividend Adjusted Stock Closing prices 40.32 43.86 47.40 50.94 54.48 58.02 61.56 65.10 68.64 72.18 75.72 79.26 price 2020 81.54 88.95 91.36 93.77 96.18 98.59 101 103.41 105.82 108.23 110.64 113.05 99.38 Dividend Adjusted Closing prices 80.62 88.03 90.44 92.85 95.26 97.67 100.08 102.49 104.90 107.31 109.72 112.13 Stock price 2021 131.96 121.26 122.15 131.46 124.61 136.96 145.86 153.12 141.50 149.80 174.05 177.57 142.53 Dividend Adjusted Closing prices 131.04 120.34 121.23 130.54 123.69 136.04 144.94 152.20 140.58 148.88 173.13 176.65 S&P 500 Dividend Adjusted Closing prices - most recent years - 2018 - 2021 Stock Dividend Adjusted Dividend Stock Common price 2018 Month price Closing prices 2019 Jan 0.42 73.32 72.90 Feb 0.42 74.80 74.38 Mar 0.42 76.28 75.86 Apr 0.42 77.76 77.34 May 0.42 79.24 78.82 Jun 0.42 80.72 80.30 Jul 0.42 82.20 81.78 Aug 0.42 83.68 83.26 0.42 85.16 84.74 0.42 86.64 86.22 0.42 88.12 87.70 0.42 89.60 89.18 81.46 Sep Oct Nov Dec Average: 89.60 93.14 96.68 100.22 103.76 107.3 110.84 114.38 117.92 121.46 125 128.54 109.07 Dividend Adjusted Closing prices 89.18 92.72 96.26 99.80 103.34 106.88 110.42 113.96 117.50 121.04 124.58 128.12 Stock price 2020 128.12 135.53 137.94 140.35 142.76 145.17 147.58 149.99 152.4 154.81 157.22 159.63 145.96 Dividend Adjusted Closing prices Stock price 2021 127.70 159.63 135.11 162.08 137.52 164.53 139.93 166.98 142.34 169.43 144.75 171.88 147.16 174.33 149.57 176.78 151.98 179.23 154.39 181.68 156.80 184.13 159.21 186.58 173.11 Dividend Adjusted Closing prices 159.21 161.66 164.11 166.56 169.01 171.46 173.91 176.36 178.81 181.26 183.71 186.16 Part 02: According to the below graph is reflecting the clear picture of the company that the relative strength is showing the continuation -Relative Strength Price change 1.6 1.4 1.2 1 0.8 0.6 0.4 0.2 0 - Jan-18 Feb-18 Mar-18 Mar-18 Apr-18 May-18 Jun-18 Jul-18 Aug-18 Sep-18 Oct-18 Nov-18 Dec-18 Jan-19 Feb-19 Mar-19 Apr-19 May-19 Jun-19 Jul-19 Aug-19 Sep-19 Oct-19 Nov-19 Dec-19 Dec-19 Jan-20 Feb-20 Mar-20 Apr-20 May-20 Jun-20 -0.2 Below is the data that being used: Date Jan-18 Feb-18 Mar-18 Relative Strength SEE MO 0.016297 0.036554 0.056811 Jul-20 Aug-20 Sep-20 Oct-20 Nov-20 Dec-20 Jan-21 Feb-21 Mar-21 Apr-21 May-2 Jun-2 Price change 220 MEM 0.056485 0.068926 0.081367 Jul-21 Aug-21 Sep-21 Oct-21 Nov-21 Dec-21 RSI (100 (100/(1+RS)) 1.603567 3.526493 5.375701 Apr-18 May-18 Jun-18 Jul-18 Aug-18 Sep-18 Oct-18 Nov-18 Dec-18 Jan-19 Feb-19 Mar-19 Apr-19 May-19 Jun-19 Jul-19 Aug-19 Sep-19 Oct-19 Nov-19 Dec-19 Jan-20 Feb-20 Mar-20 Apr-20 May-20 Jun-20 Jul-20 Aug-20 Sep-20 Oct-20 0.077068 0.097325 0.117582 0.137839 0.158096 0.178353 0.158096 0.137839 0.117582 0.097325 0.077068 0.056811 0.036554 0.056811 0.077068 0.097325 0.117582 0.137839 0.158096 0.178353 0.19861 0.218867 0.239124 0.259381 0.279638 0.299895 0.320152 0.340409 0.360666 0.380923 0.360666 0.093808 0.106249 0.11869 0.106249 0.093808 0.081367 0.068926 0.056485 0.044044 0.031603 0.019162 0.006721 -0.00572 0.006721 0.019162 0.031603 0.044044 0.056485 0.068926 0.056485 0.044044 0.031603 0.019162 0.006721 -0.00572 -0.01816 -0.00572 0.006721 0.019162 0.031603 0.019162 7.155351 8.869296 10.52111 12.1141 13.65137 15.13579 13.65137 12.1141 10.52111 8.869296 7.155351 5.375701 3.526493 5.375701 7.155351 8.869296 10.52111 12.1141 13.65137 15.13579 16.57003 17.95659 19.29783 20.59591 21.8529 23.07071 24.25115 25.39591 26.50658 27.58467 26.50658 Nov-20 Dec-20 Jan-21 Feb-21 Mar-21 Apr-21 May-21 Jun-21 Jul-21 Aug-21 Sep-21 Oct-21 Nov-21 Dec-21 0.340409 0.320152 0.299895 0.279638 0.259381 0.239124 0.259381 0.279638 0.299895 0.320152 0.340409 0.360666 0.380923 0.40118 0.006721 -0.00572 -0.01816 -0.0306 -0.04304 -0.05548 -0.06793 -0.08037 0.132075 0.344516 0.556957 0.769398 0.981839 1.19428 25.39591 24.25115 23.07071 21.8529 20.59591 19.29783 20.59591 21.8529 23.07071 24.25115 25.39591 26.50658 27.58467 28.63158 Section 02 - Estimation of Returns and Risk: Part 01: To calculate the Average Monthly and Yearly Returns for the period of 2011 - 2021, below is the following formula. For the monthly return, we are taking only one year (12 months) of 2021 to know an average monthly return. We have selected "APPLE Inc" Average Monthly Return = (Current Month price / previous month prices - 1) x 100 Month Value Monthly Return Formula 2% ((B2/129.88)-1)*100% -8% =((B3/B2)-1)*100% 1% =((B4/B3)-1)* 100% 8% =((B5/B4)-1)* 100% =((B6/B5)-1)* 100% -5% 10% =((B7/B6)-1)* 100% 6% ((B8/B7)-1)*100% 5% ((B9/B8)-1)* 100% -8% =((B10/B9)-1)*100% 6% ((B11/B10)-1)*100% 16% =((B12/B11)-1)*100% Jan-21 Feb-21 Mar-21 Apr-21 May-21 Jun-21 Jul-21 Aug-21 Sep-21 Oct-21 Nov-21 131.96 121.26 122.15 131.46 124.61 136.96 145.86 153.12 141.50 149.80 174.05 Dec-21 2% ((B13/B12)-1)*100% 177.57 142.53 Average Yearly Return = (Current year price / previous year prices - 1) x 100 Year Value Yearly Return Formula 2011 14.46 4% 2012 19.01 31% =((G2/13.88)-1)* 100% =((G3/G2)-1)* 100% =((G4/G3)-1)* 100% =((G5/G4)-1)* 100% 2013 20.04 5% 2014 27.59 38% 2015 26.32 -5% =((G6/G5)-1)*100% 2016 28.95 10% =((G7/G6)-1)* 100% 2017 42.31 46% 2018 39.44 -7% =((G8/G7)-1)*100% =((G9/G8)-1)* 100% =((G10/G9)-1)*100% 2019 73.41 86% 2020 132.69 81% =((G11/G10)-1)*100% =((G12/G11)-1)* 100% 2021 140.91 6% 51.38 Risk (3-Yr 5-Yr 10-Yr Risk/Return Analysis S&P 500 PR 30.00 20.00 10.00 0.00 -10.00 -30.00 -30.00 0.00 Standard Deviation Return as of Apr 30, 2022 | Standard Deviation as of Apr 30, 2022 Part 02: Year Book Value 2017 2018 2019 2020 2021 6.91 5.95 5.10 3.94 3.84 5.15 O 30.00 Risk & Volatility Measures Sharpe Ratio 0.82 Standard Deviation 13.58 Max Drawdown -20.00% Drawdown Peak Date Drawdown Valley Date Max Drawdown Jan 01, 2020 Mar 31, 2020 Duration 3 months As of Apr 30, 2022 Market Value 42.31 39.44 73.41 132.69 140.91 Excess Value 35.40 33.49 68.31 128.75 137.07 Section 03- Initial Public Offering: To understand the Initial Public Offering, the IPO is the term, in which the company is raising the funds and allowing all the investors to take ownership of their shares that are being listed on the stock exchange. The last offer price in the market by Apple Inc was 140.91 per share. The company is suffering from a pandemic situation and struggling with supply chain bottlenecks. It has increased the production cost and effect on the sales, resulting in the loss. The company isn't underpricing, and its annual rate of returns is 5.15%. The worth of 1000 is around 50x in the current market. Section 04- Mutual Funds & ETFs: To know and understand the Investment funds and ETFs (Exchange Traded Funds), we have chosen the "PIMCO" as an Investment Management Company. PIMCO (https://www.pimco.com/en-us/) 1. The company is offering different services like mutual funds and Exchange Traded Funds, they are offering and investing in the credit and helping to develop the sectors of the different market bonds. 2. They are helping to provide the diversified income fund based on managing the risk very well, as well as to give income-oriented complement based on core bond holdings. 3. To get success based on ETFs fixed income, it is increasing the strength of PIMCO and its investment area which is on the basis of a time-tested process. 4. They have also used the strategies of Smart beta to know about the equity and offer it to different investors based on innovations and ESG investing. 5. In the ETFs, the company has a very active command of portfolio management and is very expert in trading. Section 05- Assignment on Technical Analysis: Below are the monthly Dividend-adjusted closing prices of Apple Inc for the last four years. The Dividend of the company is $0.23 with EPS is $6.15. Year 2018 2019 2020 2021 Dividend-adjusted Closing Prices 39.44 73.41 132.69 140.91 51.38 Part 01: Apple Inc. Dividend Adjusted Closing prices - most recent years - 2018 - 2021 Dividend Month Dividend Common Stock price 2018 Adjusted Stock price 2019 Closing prices Jan 0.92 43.06 42.14 41.24 Feb 0.92 44.54 43.62 44.78 Mar 0.92 46.02 45.10 48.32 Apr 0.92 47.50 46.58 51.86 May 0.92 48.98 48.06 55.4 Jun 0.92 50.46 49.54 58.94 Jul 0.92 51.94 51.02 62.48 Aug 0.92 53.42 52.50 66.02 Sep 0.92 54.90 53.98 69.56 Oct 0.92 56.38 55.46 73.1 Nov 0.92 44.90 43.98 76.64 Dec 0.92 39.42 38.50 80.18 Average: 48.46 60.71 Dividend Adjusted Stock Closing prices 40.32 43.86 47.40 50.94 54.48 58.02 61.56 65.10 68.64 72.18 75.72 79.26 price 2020 81.54 88.95 91.36 93.77 96.18 98.59 101 103.41 105.82 108.23 110.64 113.05 99.38 Dividend Adjusted Closing prices 80.62 88.03 90.44 92.85 95.26 97.67 100.08 102.49 104.90 107.31 109.72 112.13 Stock price 2021 131.96 121.26 122.15 131.46 124.61 136.96 145.86 153.12 141.50 149.80 174.05 177.57 142.53 Dividend Adjusted Closing prices 131.04 120.34 121.23 130.54 123.69 136.04 144.94 152.20 140.58 148.88 173.13 176.65 S&P 500 Dividend Adjusted Closing prices - most recent years - 2018 - 2021 Stock Dividend Adjusted Dividend Stock Common price 2018 Month price Closing prices 2019 Jan 0.42 73.32 72.90 Feb 0.42 74.80 74.38 Mar 0.42 76.28 75.86 Apr 0.42 77.76 77.34 May 0.42 79.24 78.82 Jun 0.42 80.72 80.30 Jul 0.42 82.20 81.78 Aug 0.42 83.68 83.26 0.42 85.16 84.74 0.42 86.64 86.22 0.42 88.12 87.70 0.42 89.60 89.18 81.46 Sep Oct Nov Dec Average: 89.60 93.14 96.68 100.22 103.76 107.3 110.84 114.38 117.92 121.46 125 128.54 109.07 Dividend Adjusted Closing prices 89.18 92.72 96.26 99.80 103.34 106.88 110.42 113.96 117.50 121.04 124.58 128.12 Stock price 2020 128.12 135.53 137.94 140.35 142.76 145.17 147.58 149.99 152.4 154.81 157.22 159.63 145.96 Dividend Adjusted Closing prices Stock price 2021 127.70 159.63 135.11 162.08 137.52 164.53 139.93 166.98 142.34 169.43 144.75 171.88 147.16 174.33 149.57 176.78 151.98 179.23 154.39 181.68 156.80 184.13 159.21 186.58 173.11 Dividend Adjusted Closing prices 159.21 161.66 164.11 166.56 169.01 171.46 173.91 176.36 178.81 181.26 183.71 186.16 Part 02: According to the below graph is reflecting the clear picture of the company that the relative strength is showing the continuation -Relative Strength Price change 1.6 1.4 1.2 1 0.8 0.6 0.4 0.2 0 - Jan-18 Feb-18 Mar-18 Mar-18 Apr-18 May-18 Jun-18 Jul-18 Aug-18 Sep-18 Oct-18 Nov-18 Dec-18 Jan-19 Feb-19 Mar-19 Apr-19 May-19 Jun-19 Jul-19 Aug-19 Sep-19 Oct-19 Nov-19 Dec-19 Dec-19 Jan-20 Feb-20 Mar-20 Apr-20 May-20 Jun-20 -0.2 Below is the data that being used: Date Jan-18 Feb-18 Mar-18 Relative Strength SEE MO 0.016297 0.036554 0.056811 Jul-20 Aug-20 Sep-20 Oct-20 Nov-20 Dec-20 Jan-21 Feb-21 Mar-21 Apr-21 May-2 Jun-2 Price change 220 MEM 0.056485 0.068926 0.081367 Jul-21 Aug-21 Sep-21 Oct-21 Nov-21 Dec-21 RSI (100 (100/(1+RS)) 1.603567 3.526493 5.375701 Apr-18 May-18 Jun-18 Jul-18 Aug-18 Sep-18 Oct-18 Nov-18 Dec-18 Jan-19 Feb-19 Mar-19 Apr-19 May-19 Jun-19 Jul-19 Aug-19 Sep-19 Oct-19 Nov-19 Dec-19 Jan-20 Feb-20 Mar-20 Apr-20 May-20 Jun-20 Jul-20 Aug-20 Sep-20 Oct-20 0.077068 0.097325 0.117582 0.137839 0.158096 0.178353 0.158096 0.137839 0.117582 0.097325 0.077068 0.056811 0.036554 0.056811 0.077068 0.097325 0.117582 0.137839 0.158096 0.178353 0.19861 0.218867 0.239124 0.259381 0.279638 0.299895 0.320152 0.340409 0.360666 0.380923 0.360666 0.093808 0.106249 0.11869 0.106249 0.093808 0.081367 0.068926 0.056485 0.044044 0.031603 0.019162 0.006721 -0.00572 0.006721 0.019162 0.031603 0.044044 0.056485 0.068926 0.056485 0.044044 0.031603 0.019162 0.006721 -0.00572 -0.01816 -0.00572 0.006721 0.019162 0.031603 0.019162 7.155351 8.869296 10.52111 12.1141 13.65137 15.13579 13.65137 12.1141 10.52111 8.869296 7.155351 5.375701 3.526493 5.375701 7.155351 8.869296 10.52111 12.1141 13.65137 15.13579 16.57003 17.95659 19.29783 20.59591 21.8529 23.07071 24.25115 25.39591 26.50658 27.58467 26.50658 Nov-20 Dec-20 Jan-21 Feb-21 Mar-21 Apr-21 May-21 Jun-21 Jul-21 Aug-21 Sep-21 Oct-21 Nov-21 Dec-21 0.340409 0.320152 0.299895 0.279638 0.259381 0.239124 0.259381 0.279638 0.299895 0.320152 0.340409 0.360666 0.380923 0.40118 0.006721 -0.00572 -0.01816 -0.0306 -0.04304 -0.05548 -0.06793 -0.08037 0.132075 0.344516 0.556957 0.769398 0.981839 1.19428 25.39591 24.25115 23.07071 21.8529 20.59591 19.29783 20.59591 21.8529 23.07071 24.25115 25.39591 26.50658 27.58467 28.63158Step by Step Solution
There are 3 Steps involved in it
1 Expert Approved Answer
Step: 1 Unlock

Question Has Been Solved by an Expert!
Get step-by-step solutions from verified subject matter experts
Step: 2 Unlock
Step: 3 Unlock