

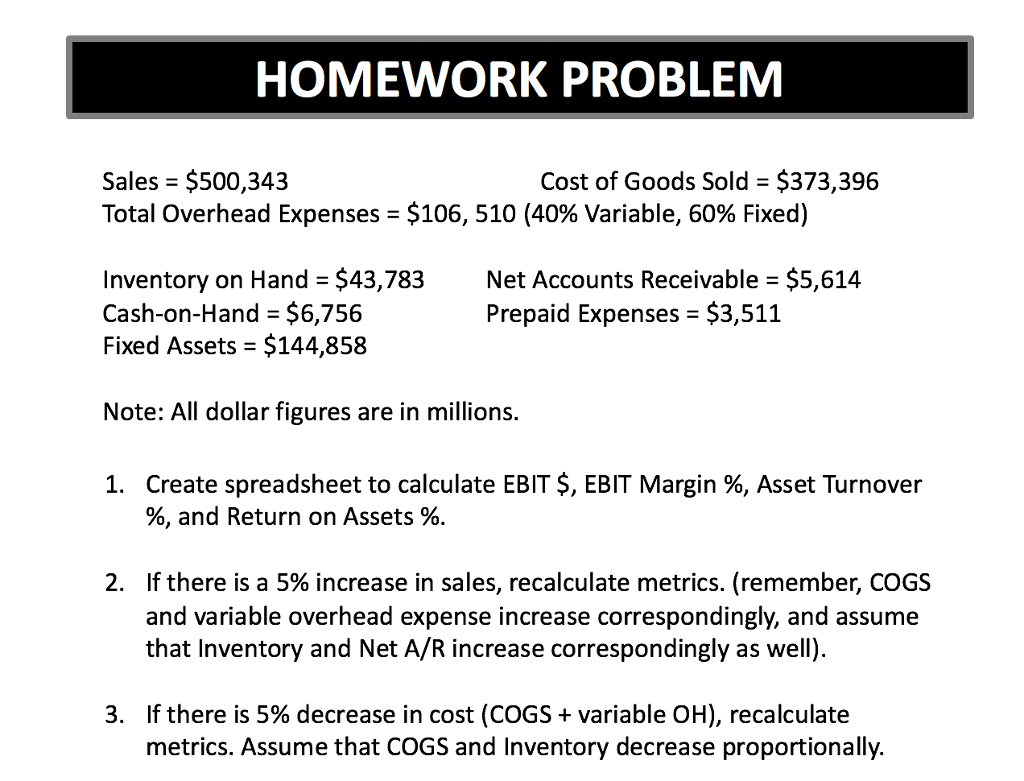
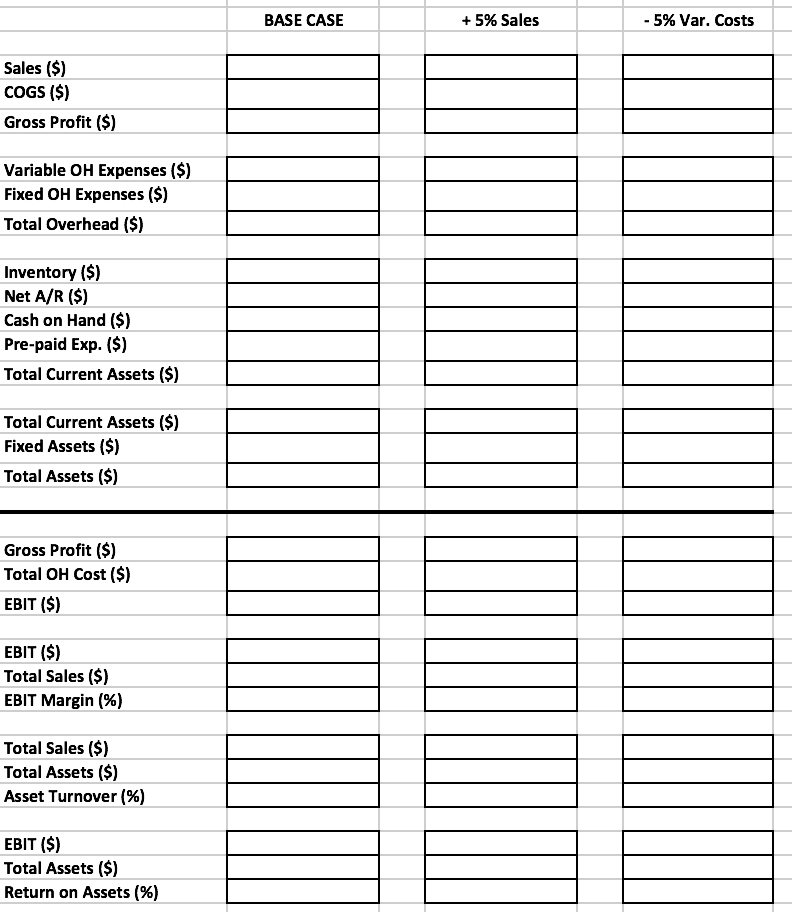
Question: Please make this chart and fill it out with formula's! thank you so much! HOMEWORK PROBLEM Sales $500,343 Total Overhead Expenses-$106, 510 (40% Variable, 60%
Please make this chart and fill it out with formula's! thank you so much!
HOMEWORK PROBLEM Sales $500,343 Total Overhead Expenses-$106, 510 (40% Variable, 60% Fixed) Cost of Goods Sold $373,396 Inventory on Hand $43,783 Net Accounts Receivable $5,614 Cash-on-Hand $6,756 Fixed Assets $144,858 Prepaid Expenses $3,511 Note: All dollar figures are in millions. Create spreadsheet to calculate EBIT $, EBIT Margin %, Asset Turnover %, and Return on Assets 96. 1. If there is a 5% increase in sales, recalculate metrics. (remember, COGS and variable overhead expense increase correspondingly, and assume that Inventory and Net A/R increase correspondingly as we 2. If there is 5% decrease in cost (COGS + variable OH), recalculate metrics. Assume that COGS and Inventory decrease proportionally. 3
Step by Step Solution
There are 3 Steps involved in it

Get step-by-step solutions from verified subject matter experts