

Question: Please make this in matlab I need this done in Matlab 1 sin(eant) 1. Perform the following summation using the for loop structure: 4A seriessum
Please make this in matlab
I need this done in Matlab
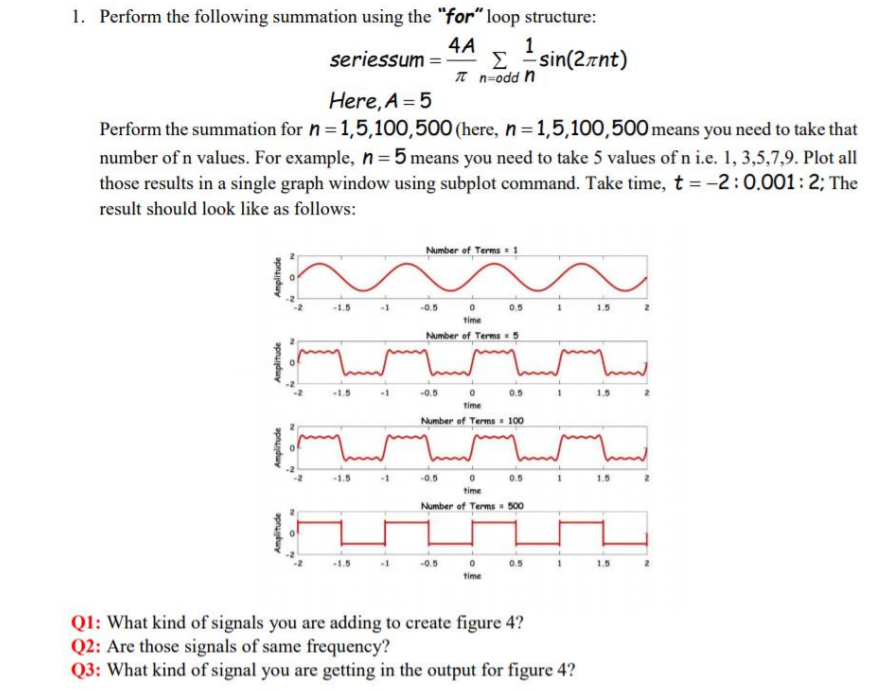
1 sin(eant) 1. Perform the following summation using the "for loop structure: 4A seriessum = ) TT n=odd n Here, A=5 Perform the summation for n=1,5,100,500 (here, n=1,5,100,500 means you need to take that number of n values. For example, n=5 means you need to take 5 values of n i.e. 1,3,5,7,9. Plot all those results in a single graph window using subplot command. Take time, t = -2:0.001:2; The result should look like as follows: Number of Terms 1 Amplitude -1.5 -0.5 0.5 1.5 0 Time Number of Terms 5 Amplitude 1 -0.5 0 0.5 Time Number of Terms 100 Amplitude -1.5 1 -0.5 0 0.5 time Number of Terms - 500 Amplitude 05 1 0 time Q1: What kind of signals you are adding to create figure 4? Q2: Are those signals of same frequency? Q3: What kind of signal you are getting in the output for figure 4? 1 sin(eant) 1. Perform the following summation using the "for loop structure: 4A seriessum = ) TT n=odd n Here, A=5 Perform the summation for n=1,5,100,500 (here, n=1,5,100,500 means you need to take that number of n values. For example, n=5 means you need to take 5 values of n i.e. 1,3,5,7,9. Plot all those results in a single graph window using subplot command. Take time, t = -2:0.001:2; The result should look like as follows: Number of Terms 1 Amplitude -1.5 -0.5 0.5 1.5 0 Time Number of Terms 5 Amplitude 1 -0.5 0 0.5 Time Number of Terms 100 Amplitude -1.5 1 -0.5 0 0.5 time Number of Terms - 500 Amplitude 05 1 0 time Q1: What kind of signals you are adding to create figure 4? Q2: Are those signals of same frequency? Q3: What kind of signal you are getting in the output for figure 4
Step by Step Solution
There are 3 Steps involved in it

Get step-by-step solutions from verified subject matter experts