

Question: please mark correct answer from these Part IV Questions 17-20 Questions 17 to 20 are based on the table below. The table describes the degree
please mark correct answer from these
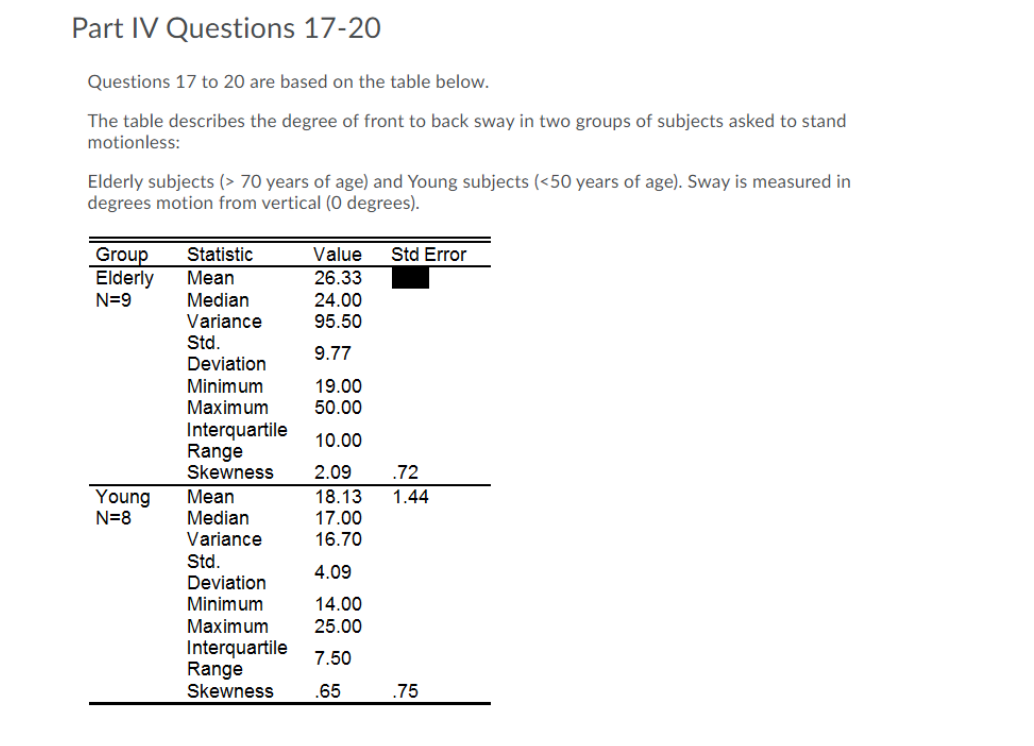
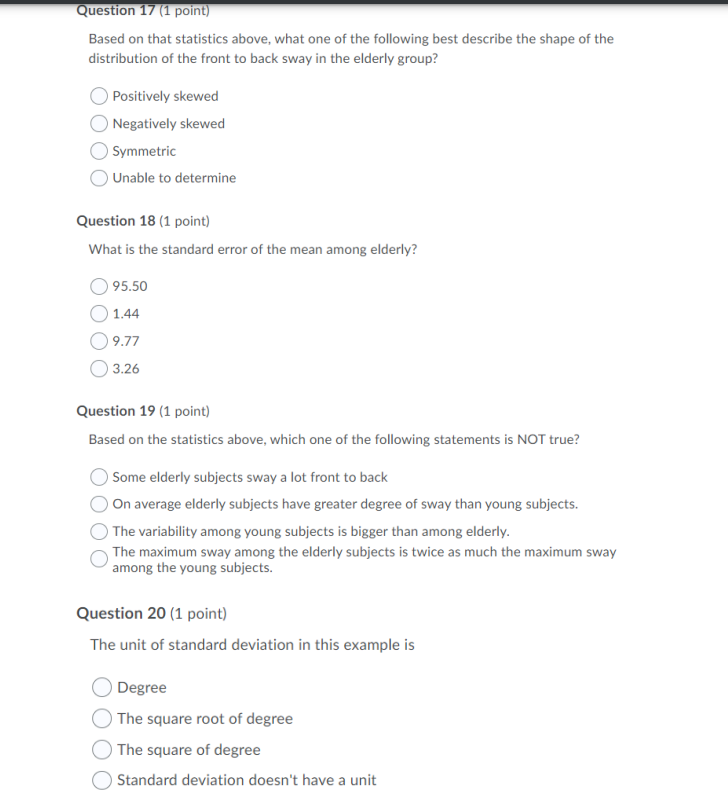
Part IV Questions 17-20 Questions 17 to 20 are based on the table below. The table describes the degree of front to back sway in two groups of subjects asked to stand motionless: Elderly subjects (> 70 years of age} and Young subjects (450 years of age). Sway is measured in degrees motion from vertical [0 degrees). Grou Statlstlc Value Std Error Elderly Mean 26.33 - N=9 Median 24.00 Variance 95.50 Std. Deviation 9'77 Minimum 19.00 Maximum 50.00 Interquartlle Range 10.00 Skawnass 2.09 .72 Young Mean 10.13 1.44 N=8 Median 17.00 Variance 16.70 Std. Deviation 4'09 Minimum 14.00 Maximum 25.00 Interquarle 7.50 Range Skewness .65 .75 on on n Based on that statistics above. what one of the following best describe the shape of the distribution of the front to back sway in the elderly group? O Positively skewed O Negatively skewed O Symmetric O Unable to determine Question 18 {1 point} What is the standard error of the mean among elderly? Question 19 {1 point} Based on the statistics above. which one of the following statements is NOT true? 0 Some elderly subjects sway a lot front to back D On average elderly subjects have greater degree of sway than young subjects, 0 The variability among young subjects is bigger than among elderly. 0 The maximum sway among the elderly subjects is twice as much the maximum sway among the young subjects. Question 20 [1 point] The unit of standard deviation in this example is 0 Degree 0 The square root of degree 0 The square of degree 0 Standard deviation doesn't have a unit
Step by Step Solution
There are 3 Steps involved in it

Get step-by-step solutions from verified subject matter experts