

Question: please need help calculating total value for two companies. can you please explain how got the answer. Total value = Ge Applications + Mabe Interest
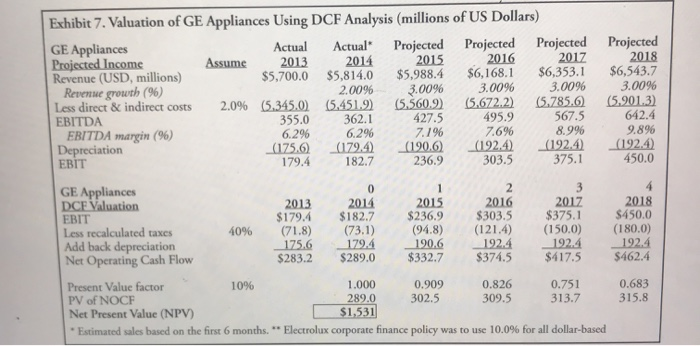
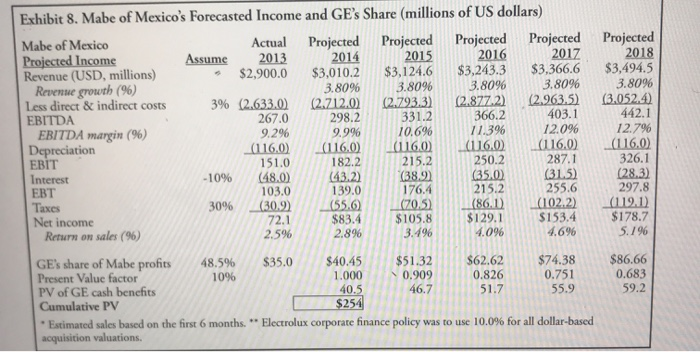
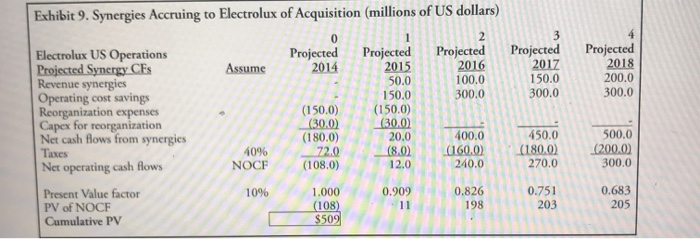
Exhibit 7. Valuation of GE Appliances Using DCF Analysis (millions of US Dollars) GE Appliances Actual Actual Projected Projected Projected Projected Projected Income Assume 2013 2014 2015 2016 2017 2018 Revenue (USD, millions) $5.700.0 $5,814.0 $5,988.4 $6,168.1 $6,353.1 $6,543.7 Revenue growth (96) 2.00% 3.00% 3.00% 3.00% 3.0096 Less direct & indirect costs 2.0% (5.345.0) (5.451.9) 5.560.9) (5.672.2) (5.785.6 (5.901.3) EBITDA 355.0 362.1 427.5 495.9 567.5 642.4 EBITDA margin (96) 6.29 6.296 7.196 7.6% 8.996 9.896 Depreciation (175.6) (179.4 (190.6 (1924) (1924) (1924) EBIT 179.4 182.7 236.9 303.5 375.1 450.0 GE Appliances DCF Valuation 2013 2014 2015 2016 2017 2018 EBIT $179.4 $182.7 $236.9 $303.5 $375.1 $450.0 Less recalculated taxes 40% (71.8) (73.1) (94.8) (121.4) (150.0) (1800) Add back depreciation 175.6 179.4 190.6 192.4 192.4 192.4 Net Operating Cash Flow $283.2 $289.0 $332.7 $374.5 $417.5 $462.4 Present Value factor 10% 1.000 0.909 0.826 0.751 0.683 PV of NOCF 289.0 302.5 309.5 313.7 315.8 Net Present Value (NPV) $1,531 "Estimated sales based on the first 6 months. " Electrolux corporate finance policy was to use 10.0% for all dollar-based Exhibit 8. Mabe of Mexico's Forecasted Income and GE's Share (millions of US dollars) Mabe of Mexico Actual Projected Projected Projected Projected Projected Income Assume 2013 2014 2015 2016 2017 Revenue (USD, millions) $2,900.0 $3,010.2 $3,124.6 $3,243.3 $3,366.6 Revenue growth (96) 3.80% 3.8096 3.80% 3.809 Less direct & indirect costs 3% (2.633.0) (2.712,0) 02.793.3) (2.877.2) (2.963.5) EBITDA 267.0 298.2 331.2 366.2 403.1 EBITDA margin (96) 9.296 9.996 10.6% 11.39 12.09 Depreciation (116.0) (116.0) (1160) (116.0) (1160) 151.0 182.2 215.2 250.2 287.1 Interest - 10% (48.0) 43.2) 38.2 (35.0 (31.5) EBT 103.0 139.0 215.2 255.6 Taxes 30% (30.9) (55.6 (70.5) (86.1) (102.2) Net income 72.1 $83.4 $105.8 $129.1 $153.4 Return on sales (96) 2.5% 2.8% 3.4% 4.096 4.6% GE's share of Mabe profits 48.5% $35.0 $40.45 $51.32 $62.62 $74.38 Present Value factor 1096 1.000 0.909 0.826 0.751 PV of GE cash benefits 40.5 46.7 55.9 Cumulative PV $254 Estimated sales based on the first 6 months. ** Electrolux corporate finance policy was to use 10.0% for all dollar-based acquisition valuations. Projected 2018 $3,494.5 3.8096 (3.052.4) 442.1 12.79 (116.0 326.1 (28.3) 297.8 (112.1) $178.7 5.796 176.4 $86.66 0.683 59.2 Exhibit 9. Synergies Accruing to Electrolux of Acquisition (millions of US dollars) Assume Projected 2014 - 2016 Projected 2017 150.0 300.0 100.0 Projected 2018 200.0 300.0 300.0 Electrolux US Operations Projected Synergy CES Revenue synergies Operating cost savings Reorganization expenses Capex for reorganization Net cash flows from synergies Taxes Net operating cash flows (150,0) 50.0 150.0 (150.0) (30.0 20.0 409 (180.0) 72.0 (108.0) 400,0 160.0) 450.0 (180.0) 270.0 500.0 (2000) 300.0 290.0 10% 51 0.826 0.751 Present Value factor PV of NOCF Cumulative PV 1.000 (108) $509 198 203 0.683 205
Step by Step Solution
There are 3 Steps involved in it

Get step-by-step solutions from verified subject matter experts