

Question: Please need help. Thank you. Which is not an ethical obligation of a statistician? Multiple Choice To know and follow accepted procedures To ensure data
Please need help. Thank you.
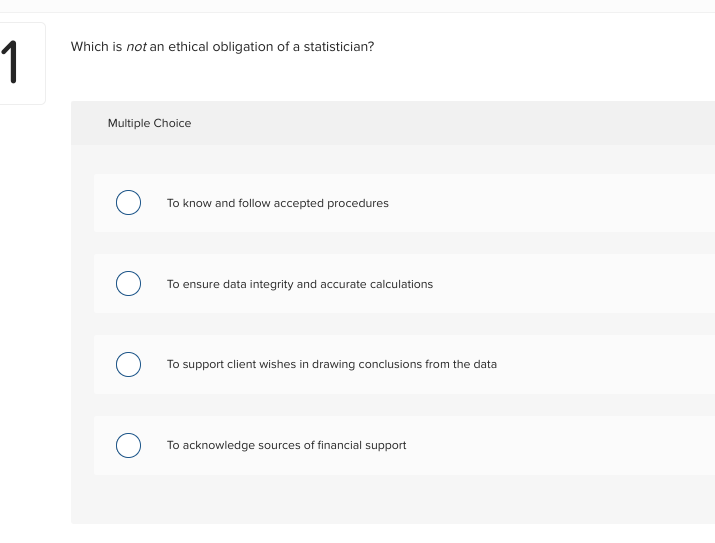
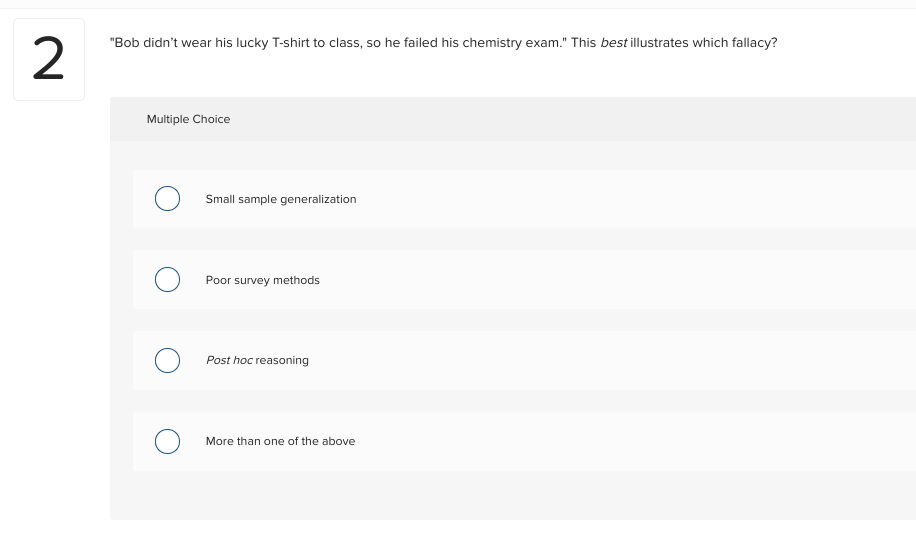
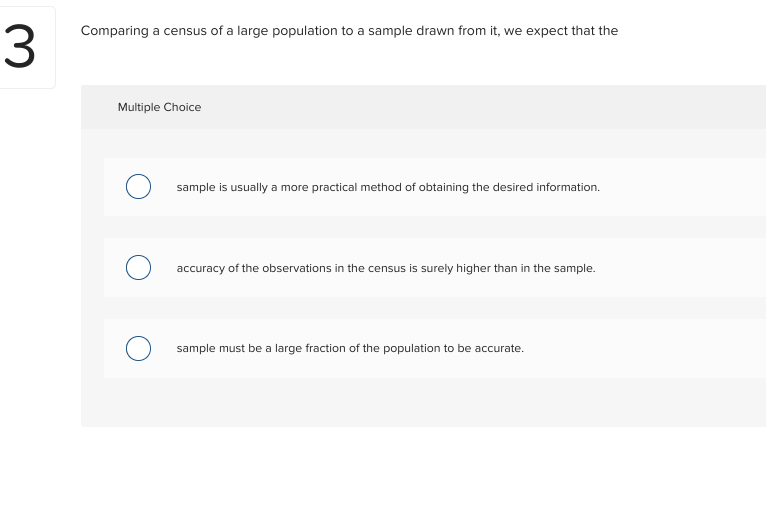
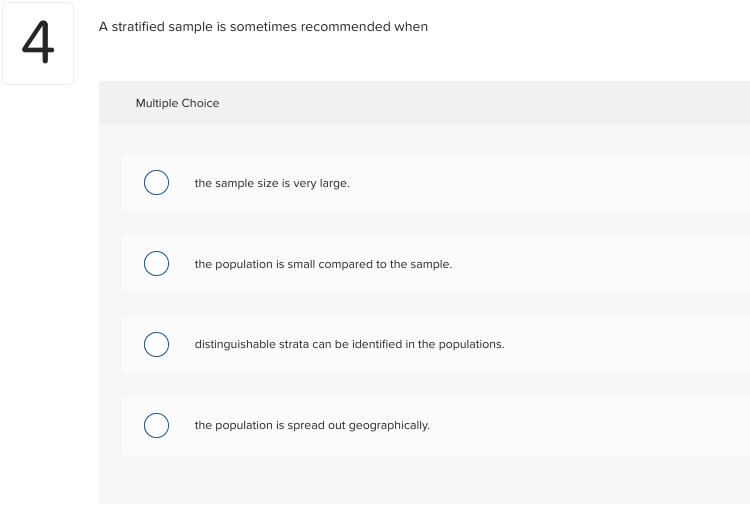
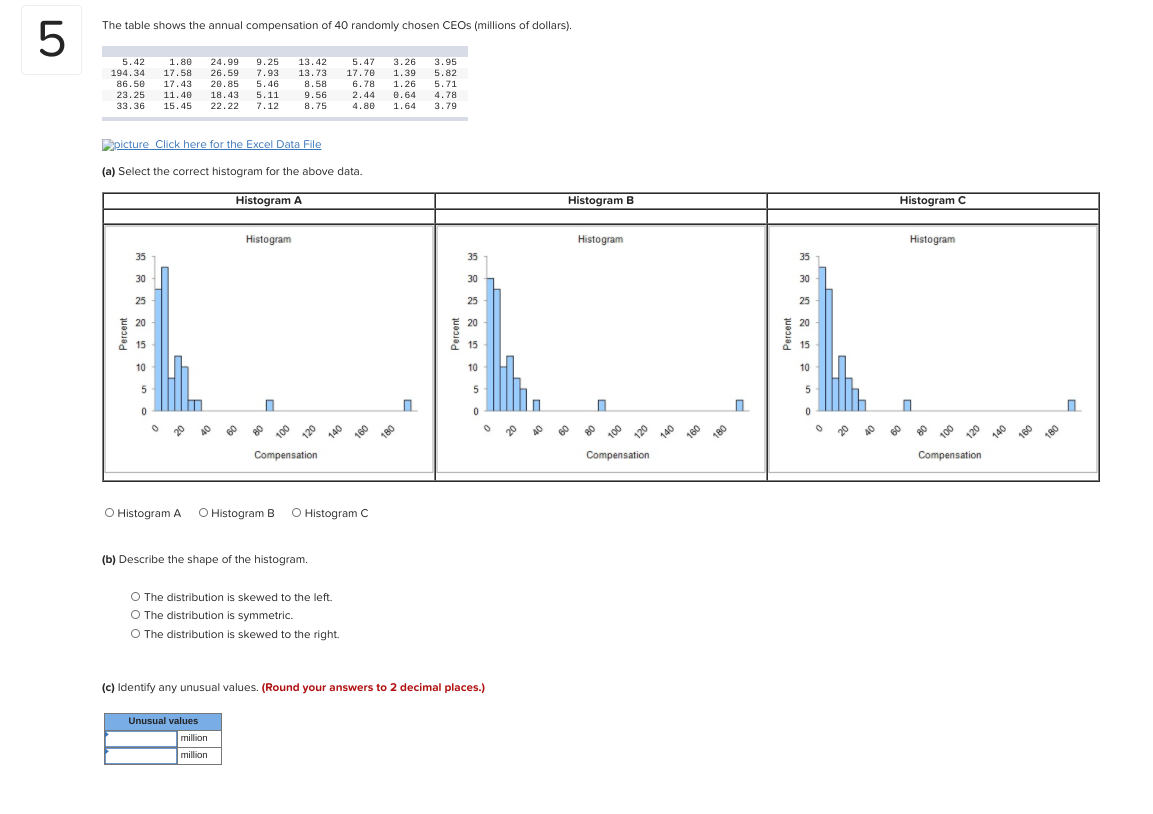
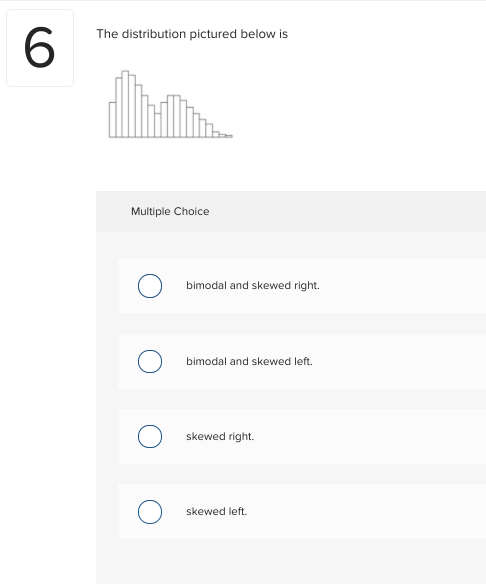
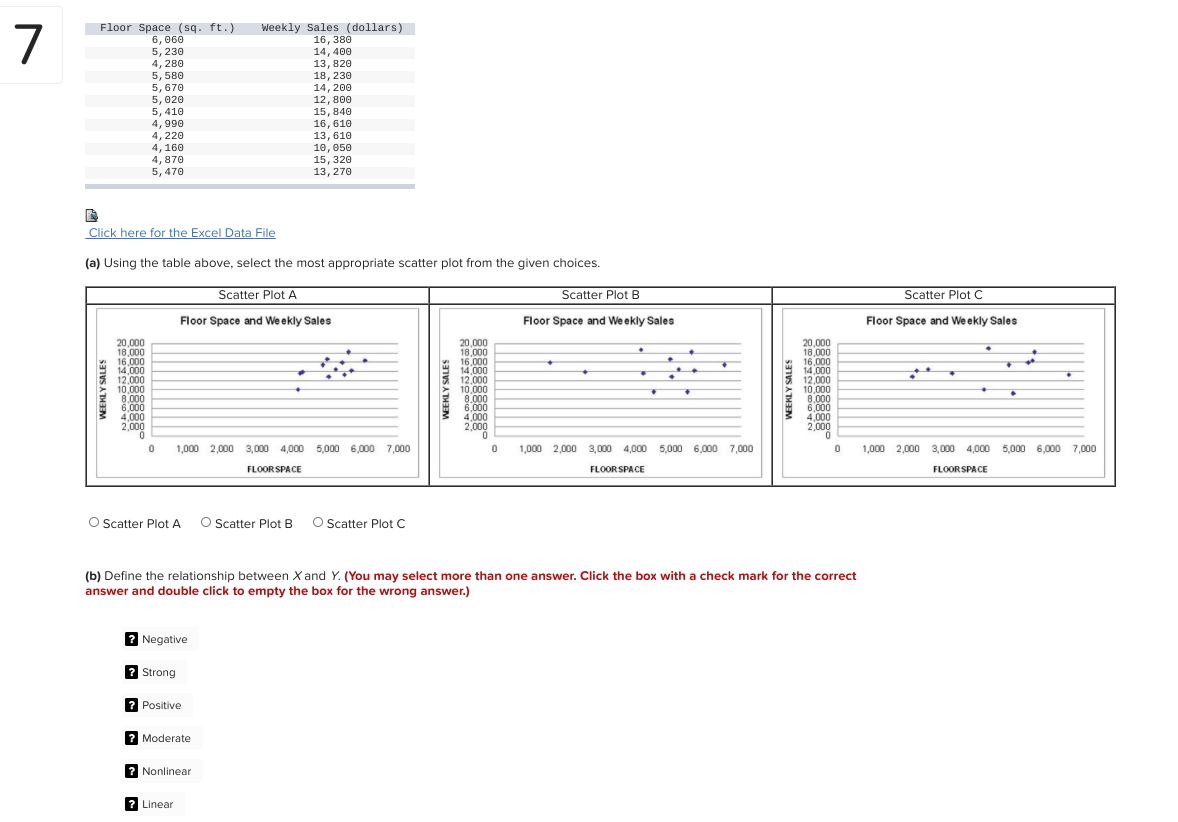
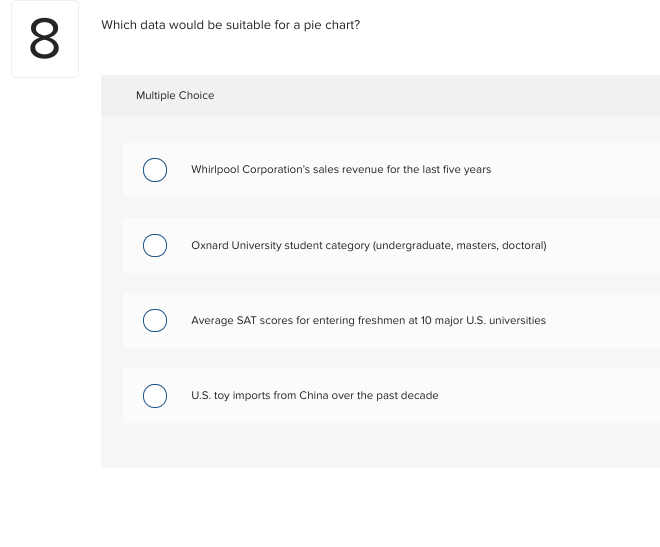
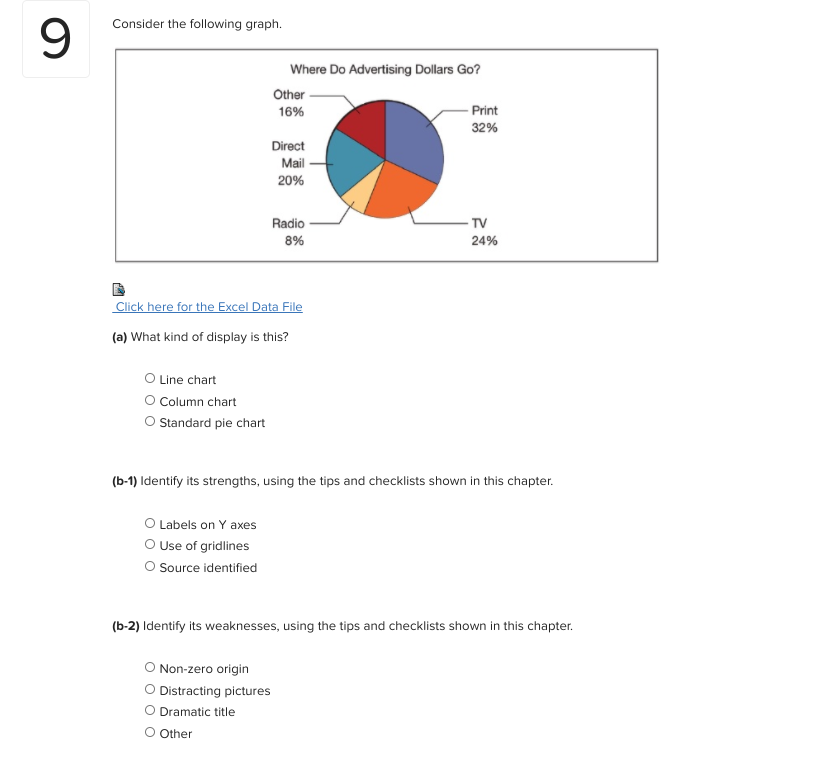
Which is not an ethical obligation of a statistician? Multiple Choice To know and follow accepted procedures To ensure data integrityI and accurate calculations To support client wishes in drawing conclusions from the data To acknowledge sources of financial support 0000 2 \"Bob didn't wear his lucky Tshirt to class. so he failed his chemistry exam." This best illustrates which fallacy? Multiple Choice 0 Small sample generalization Pour sunrey methods More than one ofthe above 0 Pastime reasoning 3 Comparing a census of a large population to a sample drawn from it, we expect that the Multiple Choice O sample is usually a more practical method of obtaining the desired information. O accuracy of the observations in the census is surely higher than in the sample. O sample must be a large fraction of the population to be accurate.4 A stratified sample is sometimes recommended when Multiple Choice O the sample size is very large. O the population is small compared to the sample. O distinguishable strata can be identified in the populations. O the population is spread out geographically.The table shows the annual compensation of 40 randomly chosen CEOs (millions of dollars). 5 5. 42 1.80 24.99 9. 25 13. 42 5.47 3.26 3.95 194.34 17.58 26.59 7.93 13.73 17.70 1. 39 5.82 86. 50 17.43 20.85 5.46 8. 58 6.78 1.26 5.71 23. 25 11. 40 18.43 5. 11 9.56 2. 44 0. 64 4.78 33.36 15 .45 22 . 22 7. 12 8.75 1. 80 1. 64 3.79 Expicture Click here for the Excel Data File (a) Select the correct histogram for the above data. Histogram A Histogram B Histogram C Histogram Histogram Histogram 35 25 20 20 Percent Percent Percent u S Compensation Compensation Compensation O Histogram A O Histogram B O Histogram C (b) Describe the shape of the histogram. O The distribution is skewed to the left. O The distribution is symmetric. O The distribution is skewed to the right. (c) Identify any unusual values. (Round your answers to 2 decimal places.) Unusual values million million6 The distribution pictured below is Multiple Choice O bimodal and skewed right. O bimodal and skewed left. O skewed right. O skewed left.Floor Space (sq. ft. ) Weekly Sales (dollars) 6, 960 16, 380 5, 230 14, 409 4, 280 13, 820 5, 580 18, 230 5, 670 14, 200 5, 020 12, 800 5, 410 15, 840 4, 990 16, 610 4, 220 13, 610 4, 160 10, 050 4, 879 15, 320 5, 470 13, 270 Click here for the Excel Data File (a) Using the table above, select the most appropriate scatter plot from the given choices. Scatter Plot A Scatter Plot B Scatter Plot C Floor Space and Weekly Sales Floor Space and Weekly Sales Floor Space and Weekly Sales 20,000 20,000 18,000 20,000 18,000 16,000 18,000 14,000 15.000 16,000 12.000 14,000 12.000 10,000 12,000 WEEKLY SALES 10.000 10.000 8.00 6,000 8,000 4.000 4 600 6,000 2.00 4,000 2.000 2.000 1,000 2,000 3,000 4,000 5,000 6,000 7,000 1,000 2,000 3,000 4,000 5,000 6,000 7,000 0 1,000 2,000 3,000 4,000 5,000 6,000 7,000 FLOOR SPACE FLOOR SPACE FLOOR SPACE O Scatter Plot A O Scatter Plot B O Scatter Plot C (b) Define the relationship between X and Y. (You may select more than one answer. Click the box with a check mark for the correct answer and double click to empty the box for the wrong answer.) 7 Negative 7 Strong 7 Positive ? Moderate ? Nonlinear 7 Linear8 Which data would be suitable for a pie chart? Multiple Choice O Whirlpool Corporation's sales revenue for the last five years O Oxnard University student category (undergraduate, masters, doctoral) O Average SAT scores for entering freshmen at 10 major U.S. universities O U.S. toy imports from China over the past decade9 Consider the following graph. Where Do Advertising Dollars Go? Other 16% Print 32% Direct Mail 20% Radio TV 8% 24% Click here for the Excel Data File (a) What kind of display is this? O Line chart O Column chart O Standard pie chart (b-1) Identify its strengths, using the tips and checklists shown in this chapter. O Labels on Y axes O Use of gridlines O Source identified (b-2) Identify its weaknesses, using the tips and checklists shown in this chapter. O Non-zero origin O Distracting pictures O Dramatic title O Other
Step by Step Solution
There are 3 Steps involved in it

Get step-by-step solutions from verified subject matter experts