

Question: please need this asap An engineer used travel demand data for the year 2018 to estimate the parameters of a shopping trip generation model. The
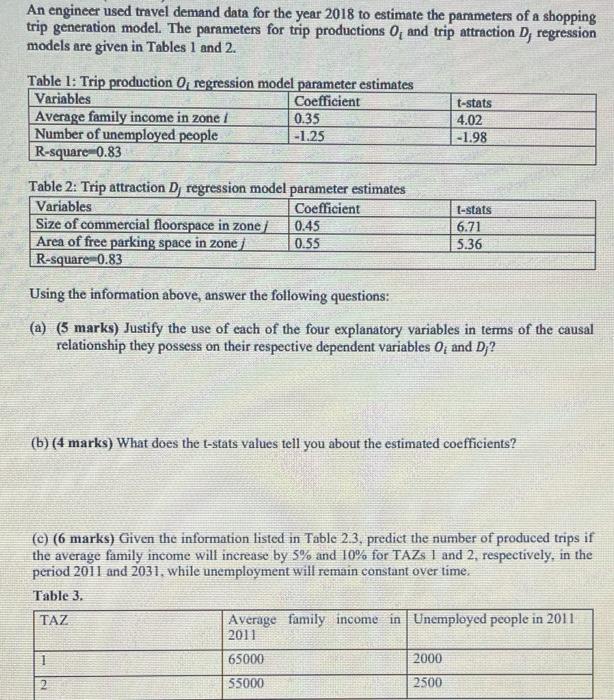
An engineer used travel demand data for the year 2018 to estimate the parameters of a shopping trip generation model. The parameters for trip productions 0 and trip attraction D, regression models are given in Tables 1 and 2. Table 1: Trip production 0 regression model parameter estimates Variables Coefficient Average family income in zone 0.35 Number of unemployed people -1.25 R-square-0.83 t-stats 4.02 -1.98 Table 2: Trip attraction D regression model parameter estimates Variables Coefficient Size of commercial floorspace in zone 0.45 Area of free parking space in zonej 0.55 R-square 0.83 I-stats 6.71 5.36 Using the information above, answer the following questions: (a) (5 marks) Justify the use of cach of the four explanatory variables in terms of the causal relationship they possess on their respective dependent variables 0, and D? (b) (4 marks) What does the t-stats values tell you about the estimated coefficients? (c) (6 marks) Given the information listed in Table 2.3. predict the number of produced trips if the average family income will increase by 3% and 10% for TAZS 1 and 2, respectively, in the period 2011 and 2031, while unemployment will remain constant over time. Table 3. TAZ Average family income in Unemployed people in 2011 2011 1 65000 2000 2 55000 2500
Step by Step Solution
There are 3 Steps involved in it

Get step-by-step solutions from verified subject matter experts