

Question: PLEASE NOTE THAT I DO NOT NEED ANY EXPLANATIONS!! ALL I NEED IS A GRAPH WITH EXACTLY DESCRIBED NUMERICAL COORDINANTS THATS ALL! THANK YOU AND
PLEASE NOTE THAT I DO NOT NEED ANY EXPLANATIONS!!
ALL I NEED IS A GRAPH WITH EXACTLY DESCRIBED NUMERICAL COORDINANTS THATS ALL! THANK YOU AND I APPRECIATE IT
PLEASE NOTE THAT I DO NOT NEED ANY EXPLANATIONS!!
ALL I NEED IS A GRAPH WITH EXACTLY DESCRIBED NUMERICAL COORDINANTS THATS ALL! THANK YOU AND I APPRECIATE IT
PLEASE NOTE THAT I DO NOT NEED ANY EXPLANATIONS!!
ALL I NEED IS A GRAPH WITH EXACTLY DESCRIBED NUMERICAL COORDINANTS THATS ALL! THANK YOU AND I APPRECIATE IT
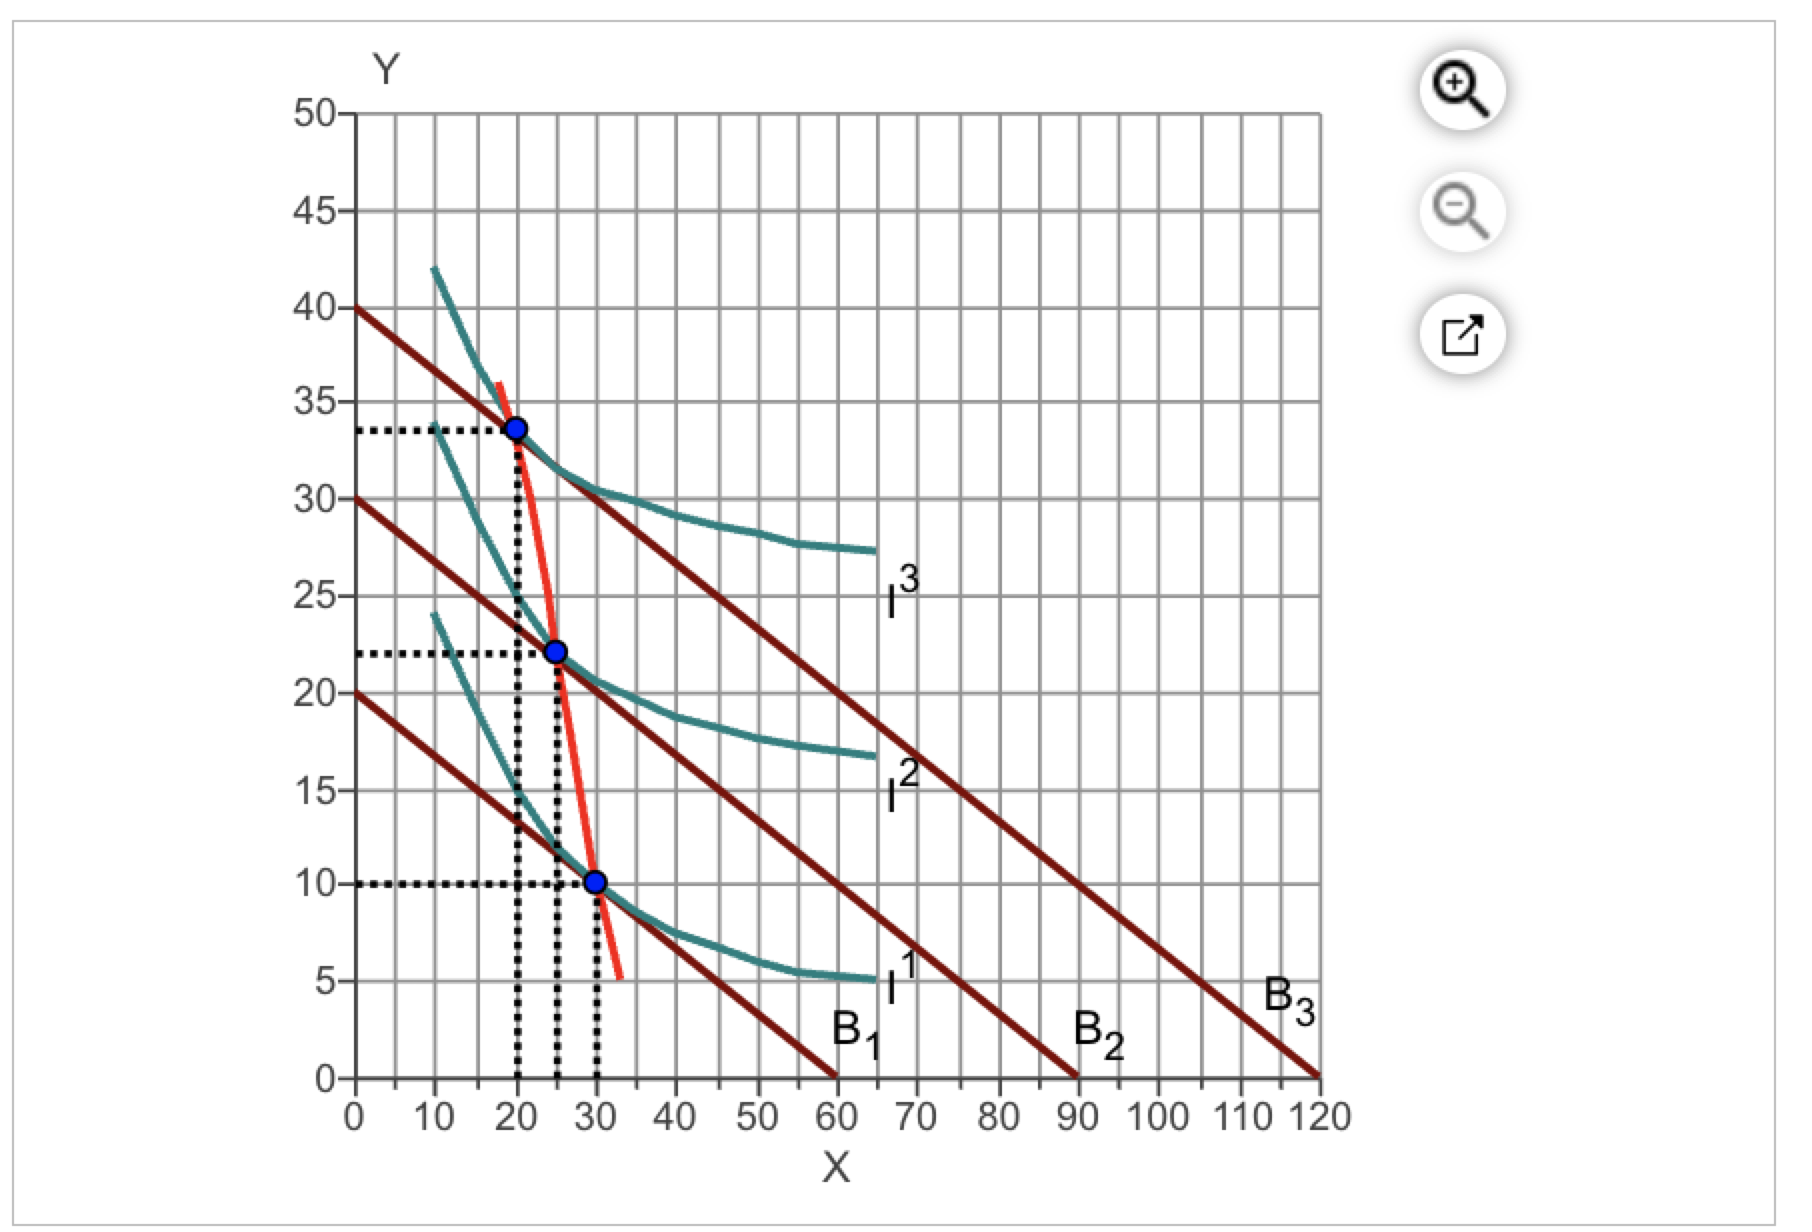
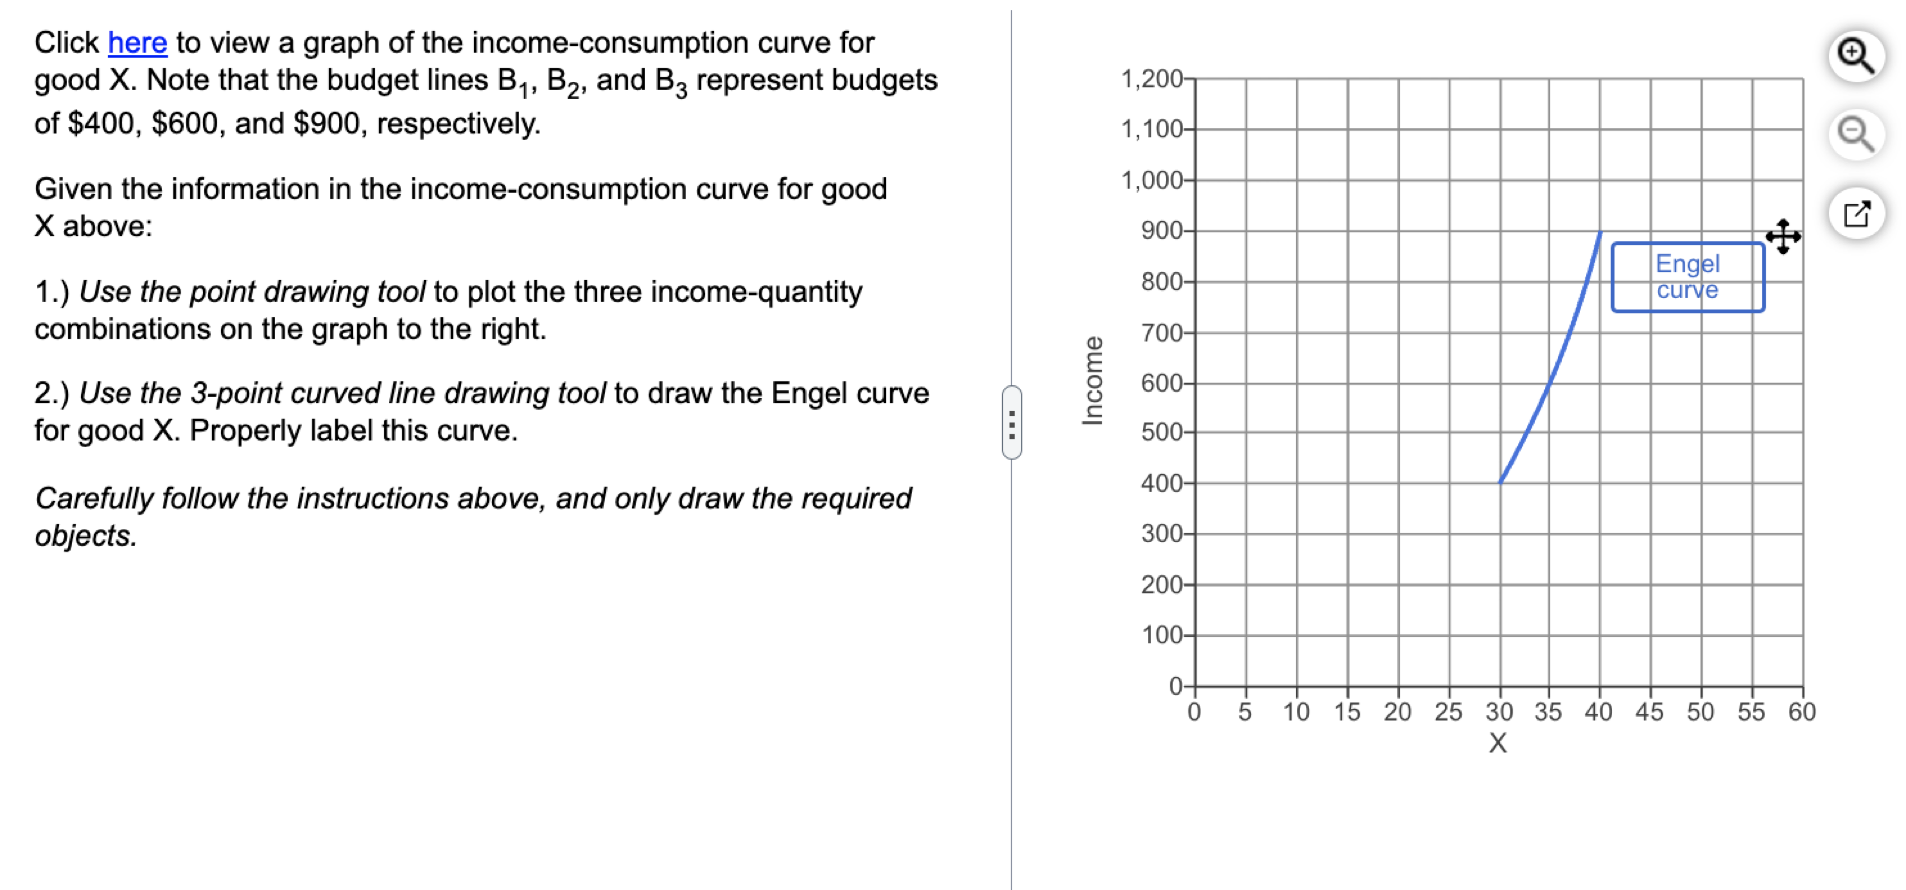
Click here to view a graph of the income-consumption curve for good X. Note that the budget lines B1,B2, and B3 represent budgets of $400,$600, and $900, respectively. Given the information in the income-consumption curve for good X above: 1.) Use the point drawing tool to plot the three income-quantity combinations on the graph to the right. 2.) Use the 3-point curved line drawing tool to draw the Engel curve for good X. Properly label this curve. Carefully follow the instructions above, and only draw the required objects
Step by Step Solution
There are 3 Steps involved in it

Get step-by-step solutions from verified subject matter experts