

Question: ********************Please note that it's a different question from the ones answered already on Chegg******************* 2. The effect of the Fed's policy on the markets for
********************Please note that it's a different question from the ones answered already on Chegg*******************
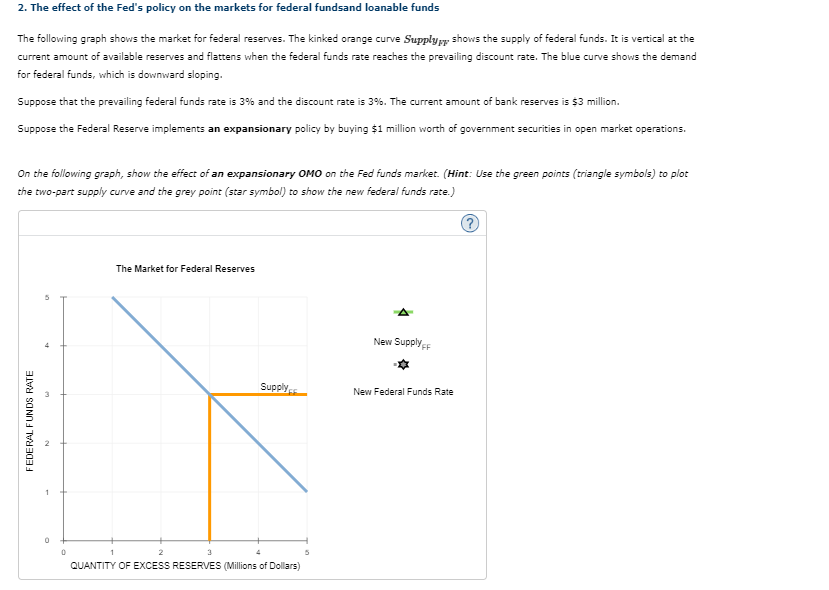
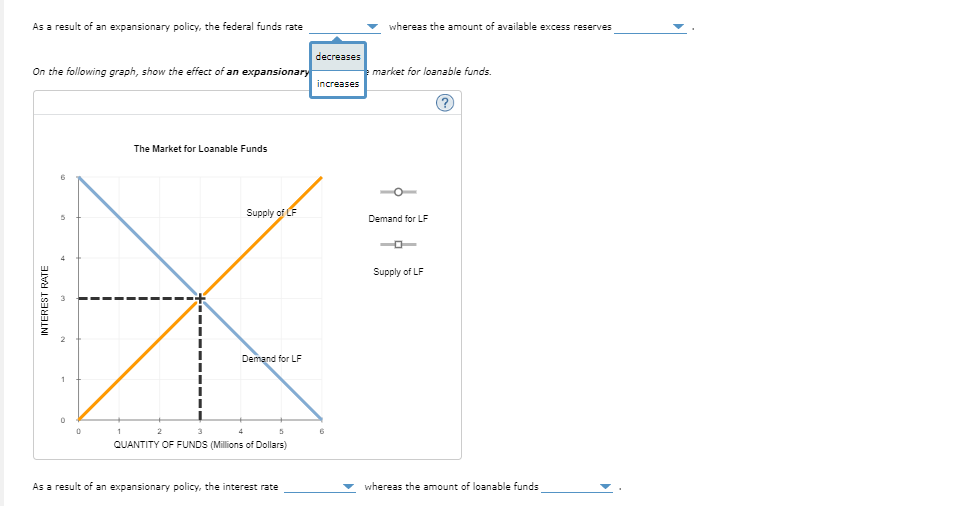
2. The effect of the Fed's policy on the markets for federal fundsand loanable funds The following graph shows the market for federal reserves. The kinked orange curve Supplypy shows the supply of federal funds. It is vertical at the current amount of available reserves and flattens when the federal funds rate reaches the prevailing discount rate. The blue curve shows the demand for federal funds, which is downward sloping. Suppose that the prevailing federal funds rate is 3% and the discount rate is 3%. The current amount of bank reserves is 53 million. Suppose the Federal Reserve implements an expansionary policy by buying $1 million worth of government securities in open market operations. On the following graph, show the effect of an expansionary OMO on the Fed funds market. (Hint: Use the green points (triangle symbols) to plot the two-part supply curve and the grey point (star symbol) to show the new federal funds rate.) The Market for Federal Reserves New Supply Supply New Federal Funds Rate FEDERAL FUNDS RATE 0 0 QUANTITY OF EXCESS RESERVES (Millions of Dollars) As a result of an expansionary policy, the federal funds rate whereas the amount of available excess reserves decreases On the following graph, show the effect of an expansionary increases market for loanable funds. The Market for Loanable Funds Supply of CF Demand for LF Supply of LF INTEREST RATE Demand for LF 0 5 QUANTITY OF FUNDS (Millions of Dollars) As a result of an expansionary policy, the interest rate whereas the amount of loanable funds 2. The effect of the Fed's policy on the markets for federal fundsand loanable funds The following graph shows the market for federal reserves. The kinked orange curve Supplypy shows the supply of federal funds. It is vertical at the current amount of available reserves and flattens when the federal funds rate reaches the prevailing discount rate. The blue curve shows the demand for federal funds, which is downward sloping. Suppose that the prevailing federal funds rate is 3% and the discount rate is 3%. The current amount of bank reserves is 53 million. Suppose the Federal Reserve implements an expansionary policy by buying $1 million worth of government securities in open market operations. On the following graph, show the effect of an expansionary OMO on the Fed funds market. (Hint: Use the green points (triangle symbols) to plot the two-part supply curve and the grey point (star symbol) to show the new federal funds rate.) The Market for Federal Reserves New Supply Supply New Federal Funds Rate FEDERAL FUNDS RATE 0 0 QUANTITY OF EXCESS RESERVES (Millions of Dollars) As a result of an expansionary policy, the federal funds rate whereas the amount of available excess reserves decreases On the following graph, show the effect of an expansionary increases market for loanable funds. The Market for Loanable Funds Supply of CF Demand for LF Supply of LF INTEREST RATE Demand for LF 0 5 QUANTITY OF FUNDS (Millions of Dollars) As a result of an expansionary policy, the interest rate whereas the amount of loanable funds
Step by Step Solution
There are 3 Steps involved in it

Get step-by-step solutions from verified subject matter experts