

Question: Please note that the book values have already been calculated, please show formulas where necessary. Thank you in advance! Please calculate the risk capital required,
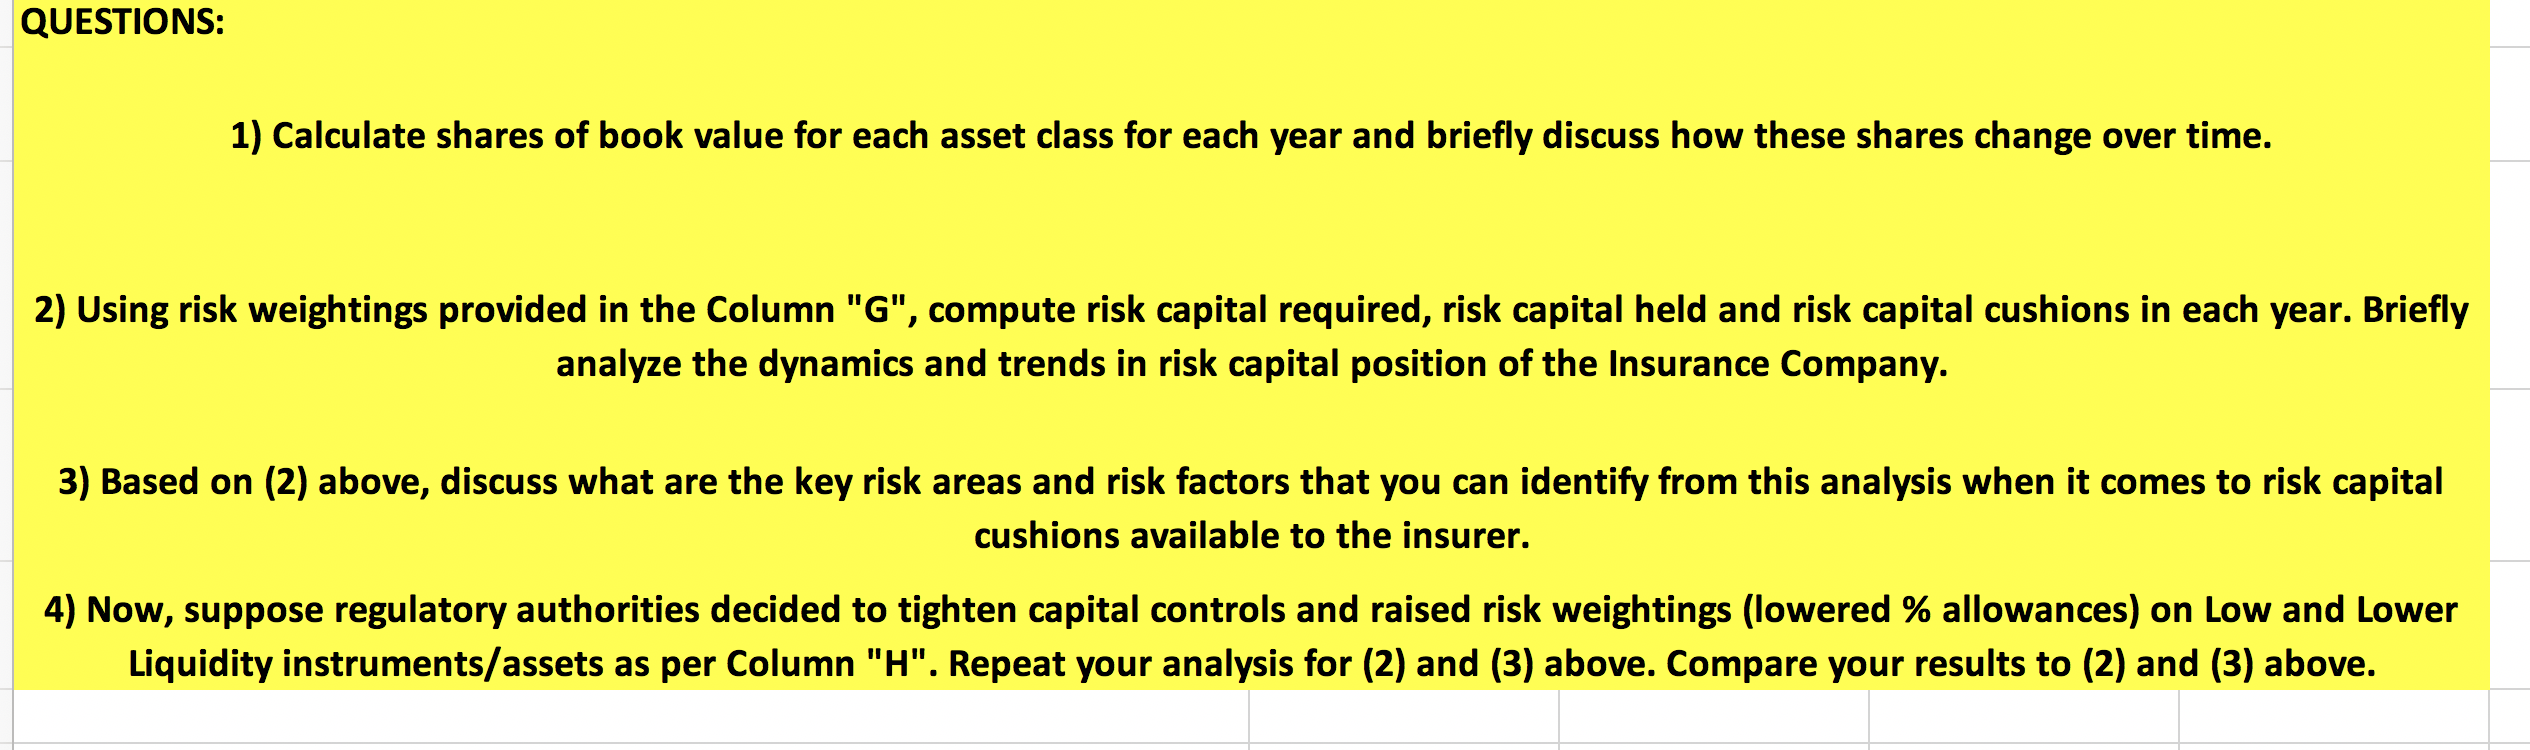
Please note that the book values have already been calculated, please show formulas where necessary. Thank you in advance! Please calculate the risk capital required, risk capital held, and risk capital cushion in each year. Please discuss how the book values for each asset change over time, and please answer questions 3 and 4. Thank you!
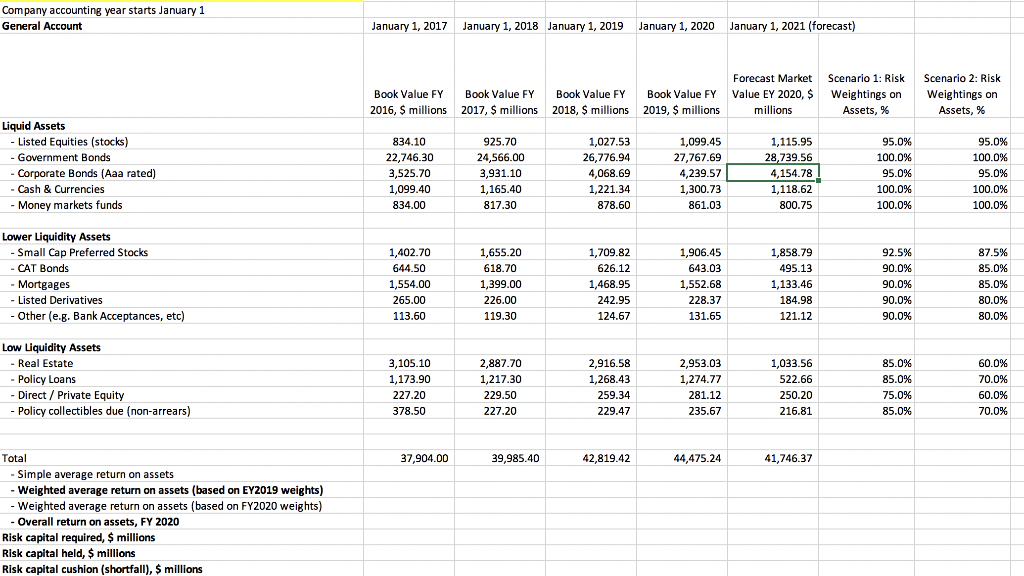
Company accounting year starts January 1 General Account January 1, 2017 January 1, 2018 January 1, 2019 January 1, 2020 January 1, 2021 (forecast) Forecast Market Scenario 1: Risk Book Value FY Book Value FY Book Value FY Book Value FY Value EY 2020, $ Weightings on 2016, $ millions 2017, $ millions 2018, $ millions 2019, $ millions millions Assets, % Scenario 2: Risk Weightings on Assets, % Liquid Assets - Listed Equities (stocks) - Government Bonds - Corporate Bonds (Aaa rated) - Cash & Currencies - Money markets funds 834.10 22,746.30 3,525.70 1,099.40 834.00 925.70 24,566.00 3,931.10 1,165,40 817.30 1,027.53 26,776.94 4,068.69 1,221.34 878.60 1,099.45 27,767.69 4,239.57 1,300.73 861.03 1,115.95 28,739.56 4,154.78 1,118.62 800.75 95.0% % 100.0% 95.0% 100.0% 100.0% 95.0% 100.0% 95.0% 100.0% 100.0% Lower Liquidity Assets - Small Cap Preferred Stocks - CAT Bonds Mortgages Listed Derivatives -Other (e.g. Bank Acceptances, etc) 1,402.70 644.50 1,554.00 265.00 113.60 1,655.20 618.70 1,399.00 226.00 119.30 1,709.82 626.12 1,468.95 242.95 124.67 1,906.45 643.03 1,552.68 228.37 131.65 1,858.79 495.13 1,133.46 184.98 121.12 92.5% 90.0% 90.0% 90.0% 90.0% 87.5% 85.0% 85.0% 80.0% 80.0% Low Liquidity Assets - Real Estate - Policy Loans Direct / Private Equity - Policy collectibles due (non-arrears) 3.105.10 1,173.90 227.20 378.50 2,887.70 1,217.30 229.50 227.20 2,916.58 1,268.43 259.34 229.47 2,953.03 1,274.77 281.12 235.67 1,033.56 522.66 250.20 216.81 85.0% 85.0% 75.0% 85.0% 60.0% 70.0% 60.0% 70.0% 37,904.00 39,985.40 42,819.42 44,475.24 41,746.37 Total - Simple average return on assets - Weighted average return on assets (based on EY2019 weights) - Weighted average return on assets (based on FY2020 weights) - Overall return on assets, FY 2020 Risk capital required, $ millions Risk capital held, $ millions Risk capital cushion (shortfall), $ millions Company accounting year starts January 1 General Account January 1, 2017 January 1, 2018 January 1, 2019 January 1, 2020 January 1, 2021 (forecast) Forecast Market Scenario 1: Risk Book Value FY Book Value FY Book Value FY Book Value FY Value EY 2020, $ Weightings on 2016, $ millions 2017, $ millions 2018, $ millions 2019, $ millions millions Assets, % Scenario 2: Risk Weightings on Assets, % Liquid Assets - Listed Equities (stocks) - Government Bonds - Corporate Bonds (Aaa rated) - Cash & Currencies - Money markets funds 834.10 22,746.30 3,525.70 1,099.40 834.00 925.70 24,566.00 3,931.10 1,165,40 817.30 1,027.53 26,776.94 4,068.69 1,221.34 878.60 1,099.45 27,767.69 4,239.57 1,300.73 861.03 1,115.95 28,739.56 4,154.78 1,118.62 800.75 95.0% % 100.0% 95.0% 100.0% 100.0% 95.0% 100.0% 95.0% 100.0% 100.0% Lower Liquidity Assets - Small Cap Preferred Stocks - CAT Bonds Mortgages Listed Derivatives -Other (e.g. Bank Acceptances, etc) 1,402.70 644.50 1,554.00 265.00 113.60 1,655.20 618.70 1,399.00 226.00 119.30 1,709.82 626.12 1,468.95 242.95 124.67 1,906.45 643.03 1,552.68 228.37 131.65 1,858.79 495.13 1,133.46 184.98 121.12 92.5% 90.0% 90.0% 90.0% 90.0% 87.5% 85.0% 85.0% 80.0% 80.0% Low Liquidity Assets - Real Estate - Policy Loans Direct / Private Equity - Policy collectibles due (non-arrears) 3.105.10 1,173.90 227.20 378.50 2,887.70 1,217.30 229.50 227.20 2,916.58 1,268.43 259.34 229.47 2,953.03 1,274.77 281.12 235.67 1,033.56 522.66 250.20 216.81 85.0% 85.0% 75.0% 85.0% 60.0% 70.0% 60.0% 70.0% 37,904.00 39,985.40 42,819.42 44,475.24 41,746.37 Total - Simple average return on assets - Weighted average return on assets (based on EY2019 weights) - Weighted average return on assets (based on FY2020 weights) - Overall return on assets, FY 2020 Risk capital required, $ millions Risk capital held, $ millions Risk capital cushion (shortfall), $ millions
Step by Step Solution
There are 3 Steps involved in it

Get step-by-step solutions from verified subject matter experts