

Question: Please only answer c and d, thank you! 4. The graph shows a newspaper's annual average circulation data a) Describe the trend in sales. b)
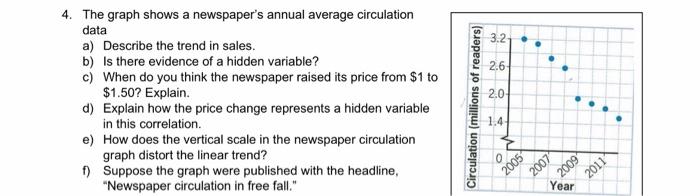
4. The graph shows a newspaper's annual average circulation data a) Describe the trend in sales. b) Is there evidence of a hidden variable? c) When do you think the newspaper raised its price from $1 to $1.50 ? Explain. d) Explain how the price change represents a hidden variable in this correlation. e) How does the vertical scale in the newspaper circulation graph distort the linear trend? f) Suppose the graph were published with the headline, "Newspaper circulation in free fall." 4. The graph shows a newspaper's annual average circulation data a) Describe the trend in sales. b) Is there evidence of a hidden variable? c) When do you think the newspaper raised its price from $1 to $1.50 ? Explain. d) Explain how the price change represents a hidden variable in this correlation. e) How does the vertical scale in the newspaper circulation graph distort the linear trend? f) Suppose the graph were published with the headline, "Newspaper circulation in free fall
Step by Step Solution
There are 3 Steps involved in it

Get step-by-step solutions from verified subject matter experts