

Question: PLEASE ONLY ANSWER (D) and the Extra Credit!! I appreciate it! e 0.51 0.71 0.02 0.12 0.3 0.5 62. (A) Diagram and describe using models
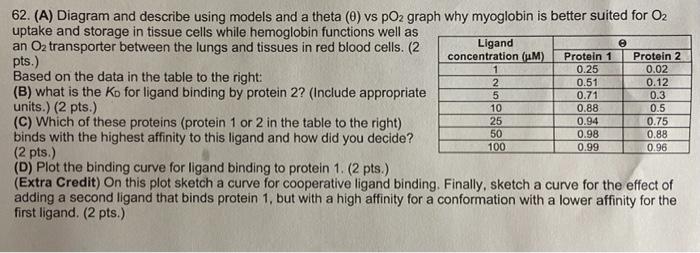
e 0.51 0.71 0.02 0.12 0.3 0.5 62. (A) Diagram and describe using models and a theta (O) vs pO2 graph why myoglobin is better suited for O2 uptake and storage in tissue cells while hemoglobin functions well as an O2 transporter between the lungs and tissues in red blood cells. (2 Ligand concentration (M) Protein 1 pts.) Protein 2 1 0.25 Based on the data in the table to the right: (B) what is the Ko for ligand binding by protein 2? (Include appropriate units.) (2 pts.) 0.88 (C) Which of these proteins (protein 1 or 2 in the table to the right) 0.94 binds with the highest affinity to this ligand and how did you decide? 0.96 (2 pts.) (D) Plot the binding curve for ligand binding to protein 1. (2 pts.) (Extra Credit) On this plot sketch a curve for cooperative ligand binding. Finally, sketch a curve for the effect of adding a second ligand that binds protein 1, but with a high affinity for a conformation with a lower affinity for the first ligand. (2 pts.) 2 5 10 25 50 100 0.75 0.88 0.98 0.99
Step by Step Solution
There are 3 Steps involved in it

Get step-by-step solutions from verified subject matter experts