

Question: Please only answer if you can do questions A through G completely!!! 12.22 (LO 1, 2, 3) Excel Comprehensive financial statement analysis Pippin Piping Co.
Please only answer if you can do questions A through G completely!!!
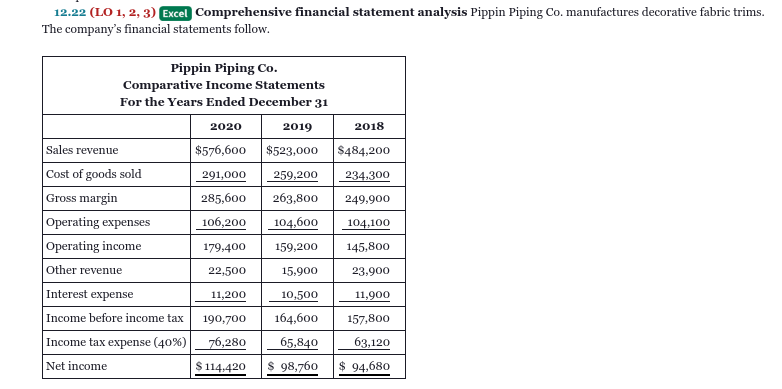
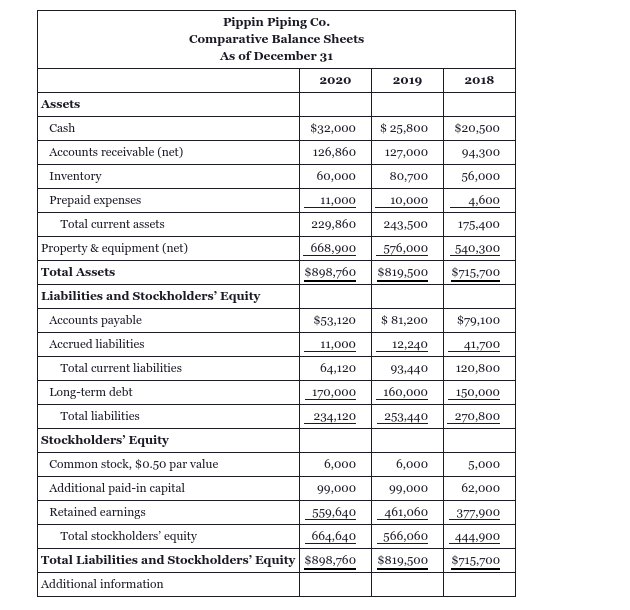
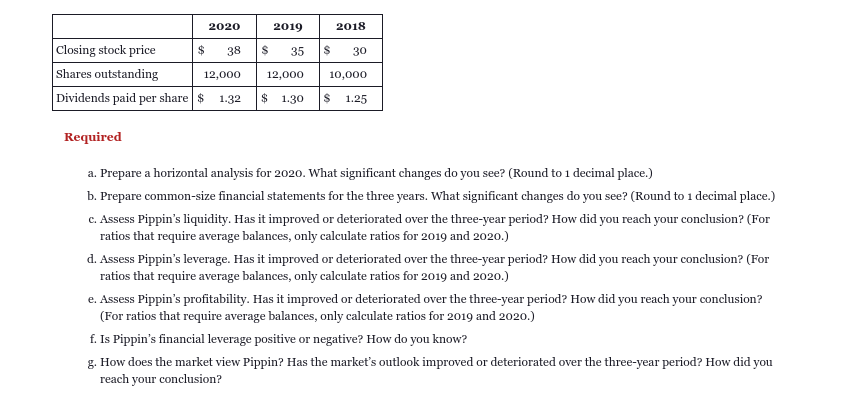
12.22 (LO 1, 2, 3) Excel Comprehensive financial statement analysis Pippin Piping Co. manufactures decorative fabric trims. The company's financial statements follow. Pippin Piping Co. Comparative Income Statements For the Years Ended December 31 2020 2019 2018 Sales revenue $576,600 $523,000 $484,200 Cost of goods sold 291,000 259,200 234,300 Gross margin 285,600 263,800 249,900 Operating expenses 106,200 104,600 104,100 Operating income 179,400 159,200 145,800 Other revenue 22,500 15,900 23.900 Interest expense 11,200 10,500 11,900 Income before income tax 190,700 164,600 157,800 Income tax expense (40%) 76,280 65,840 63,120 Net income $ 114,420 $ 98,760 $ 94,680 2018 $20,500 94.300 56,000 4,600 175,400 540,300 $715.700 Pippin Piping Co. Comparative Balance Sheets As of December 31 2020 2019 Assets Cash $32,000 $ 25,800 Accounts receivable (net) 126,860 127,000 Inventory 60,000 80,700 Prepaid expenses 11,000 10,000 Total current assets 229,860 243,500 Property & equipment (net) 668,900 576,000 Total Assets $898,760 $819,500 Liabilities and Stockholders' Equity Accounts payable $53,120 $ 81,200 Accrued liabilities 11,000 12,240 Total current liabilities 64,120 93,440 Long-term debt 170,000 160,000 Total liabilities 234,120 253,440 Stockholders' Equity Common stock, $0.50 par value 6,000 6,000 Additional paid-in capital 99,000 99,000 Retained earnings 559,640 461,060 Total stockholders' equity 664,640 566, Total Liabilities and Stockholders' Equity 5898,760 $819,500 Additional information $79,100 41.700 120,800 150,000 270,800 5,000 62,000 377.900 444,900 $715.700 2020 2019 2018 S 35 $ 30 Closing stock price $ 38 Shares outstanding 12,000 Dividends paid per share $ 1.32 12,000 10,000 $ 1.30 S 1.25 Required a. Prepare a horizontal analysis for 2020. What significant changes do you see? (Round to 1 decimal place.) b. Prepare common-size financial statements for the three years. What significant changes do you see? (Round to 1 decimal place.) C. Assess Pippin's liquidity. Has it improved or deteriorated over the three-year period? How did you reach your conclusion? (For ratios that require average balances, only calculate ratios for 2019 and 2020.) d. Assess Pippin's leverage. Has it improved or deteriorated over the three-year period? How did you reach your conclusion? (For ratios that require average balances, only calculate ratios for 2019 and 2020.) e. Assess Pippin's profitability. Has it improved or deteriorated over the three-year period? How did you reach your conclusion? (For ratios that require average balances, only calculate ratios for 2019 and 2020.) f. Is Pippin's financial leverage positive or negative? How do you know? g. How does the market view Pippin? Has the market's outlook improved or deteriorated over the three-year period? How did you reach your conclusion? 12.22 (LO 1, 2, 3) Excel Comprehensive financial statement analysis Pippin Piping Co. manufactures decorative fabric trims. The company's financial statements follow. Pippin Piping Co. Comparative Income Statements For the Years Ended December 31 2020 2019 2018 Sales revenue $576,600 $523,000 $484,200 Cost of goods sold 291,000 259,200 234,300 Gross margin 285,600 263,800 249,900 Operating expenses 106,200 104,600 104,100 Operating income 179,400 159,200 145,800 Other revenue 22,500 15,900 23.900 Interest expense 11,200 10,500 11,900 Income before income tax 190,700 164,600 157,800 Income tax expense (40%) 76,280 65,840 63,120 Net income $ 114,420 $ 98,760 $ 94,680 2018 $20,500 94.300 56,000 4,600 175,400 540,300 $715.700 Pippin Piping Co. Comparative Balance Sheets As of December 31 2020 2019 Assets Cash $32,000 $ 25,800 Accounts receivable (net) 126,860 127,000 Inventory 60,000 80,700 Prepaid expenses 11,000 10,000 Total current assets 229,860 243,500 Property & equipment (net) 668,900 576,000 Total Assets $898,760 $819,500 Liabilities and Stockholders' Equity Accounts payable $53,120 $ 81,200 Accrued liabilities 11,000 12,240 Total current liabilities 64,120 93,440 Long-term debt 170,000 160,000 Total liabilities 234,120 253,440 Stockholders' Equity Common stock, $0.50 par value 6,000 6,000 Additional paid-in capital 99,000 99,000 Retained earnings 559,640 461,060 Total stockholders' equity 664,640 566, Total Liabilities and Stockholders' Equity 5898,760 $819,500 Additional information $79,100 41.700 120,800 150,000 270,800 5,000 62,000 377.900 444,900 $715.700 2020 2019 2018 S 35 $ 30 Closing stock price $ 38 Shares outstanding 12,000 Dividends paid per share $ 1.32 12,000 10,000 $ 1.30 S 1.25 Required a. Prepare a horizontal analysis for 2020. What significant changes do you see? (Round to 1 decimal place.) b. Prepare common-size financial statements for the three years. What significant changes do you see? (Round to 1 decimal place.) C. Assess Pippin's liquidity. Has it improved or deteriorated over the three-year period? How did you reach your conclusion? (For ratios that require average balances, only calculate ratios for 2019 and 2020.) d. Assess Pippin's leverage. Has it improved or deteriorated over the three-year period? How did you reach your conclusion? (For ratios that require average balances, only calculate ratios for 2019 and 2020.) e. Assess Pippin's profitability. Has it improved or deteriorated over the three-year period? How did you reach your conclusion? (For ratios that require average balances, only calculate ratios for 2019 and 2020.) f. Is Pippin's financial leverage positive or negative? How do you know? g. How does the market view Pippin? Has the market's outlook improved or deteriorated over the three-year period? How did you reach your conclusion
Step by Step Solution
There are 3 Steps involved in it

Get step-by-step solutions from verified subject matter experts