

Question: Please only answer the graph that is highlighted in red. 7. Global flight to quality In the autumn of 2008, investors, concerned about liquidity in
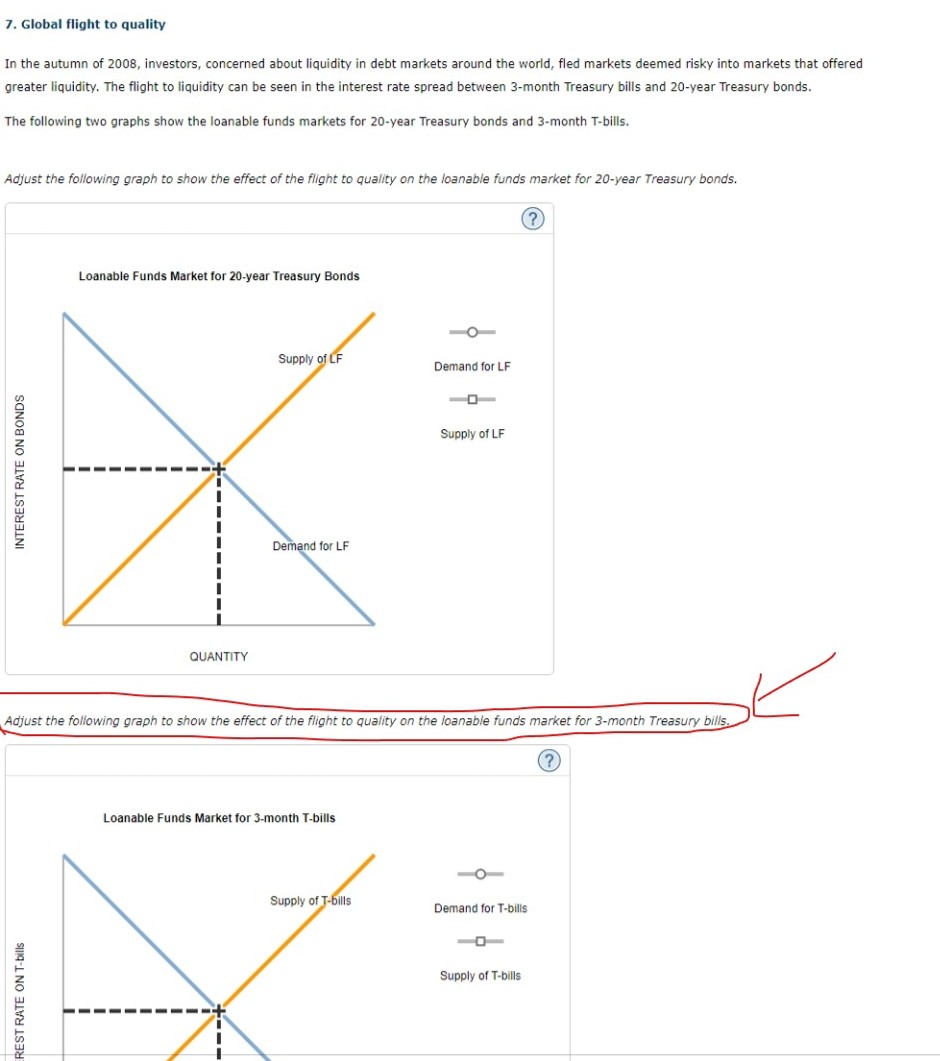
7. Global flight to quality In the autumn of 2008, investors, concerned about liquidity in debt markets around the world, fled markets deemed risky into markets that offered greater liquidity, The flight to liquidity can be seen in the interest rate spread between 3-month Treasury bills and 20-year Treasury bonds. The following two graphs show the loanable funds markets for 20-year Treasury bonds and 3-month T-bills. Adjust the following graph to show the effect of the flight to quality on the loanable funds market for 20-year Treasury bonds. Loanable Funds Market tor 20-year Treasury Bonds Suppry Demand for LF supply of LF nd LF QUANTITY Adjust the following graph to show the effect of the flight to Quality on the loanable funds market for 3-month Treasury b'/ Loanable Funds Market tor 3-month T-bills Supply of Ils Dernand for T-bills supply Of T-bills
Step by Step Solution
There are 3 Steps involved in it

Get step-by-step solutions from verified subject matter experts