

Question: Please only answer this in EXCEL format. you can see it from the screenshots given. Actual production for the month 13,500 units Variable overhead is
Please only answer this in EXCEL format. you can see it from the screenshots given.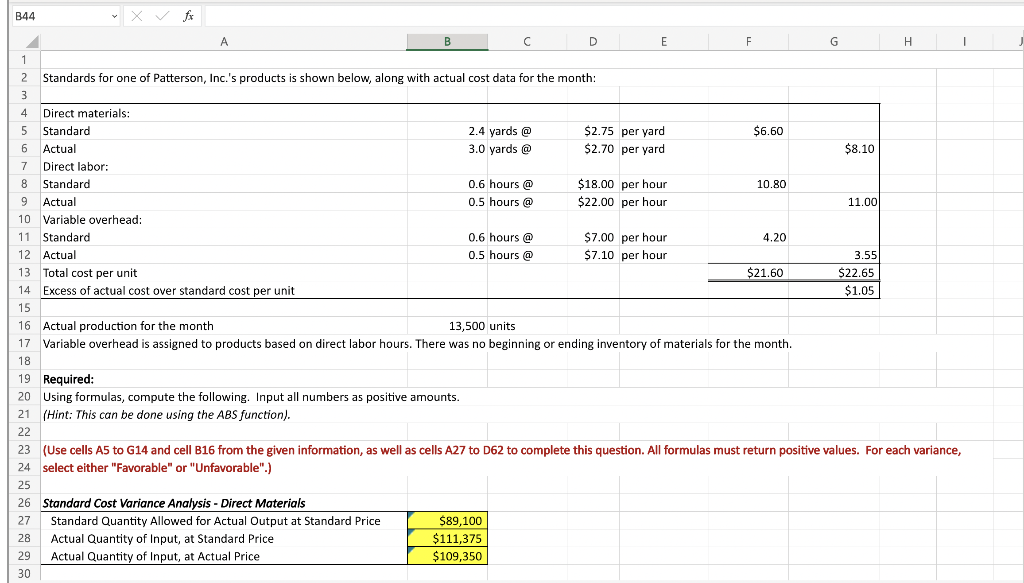
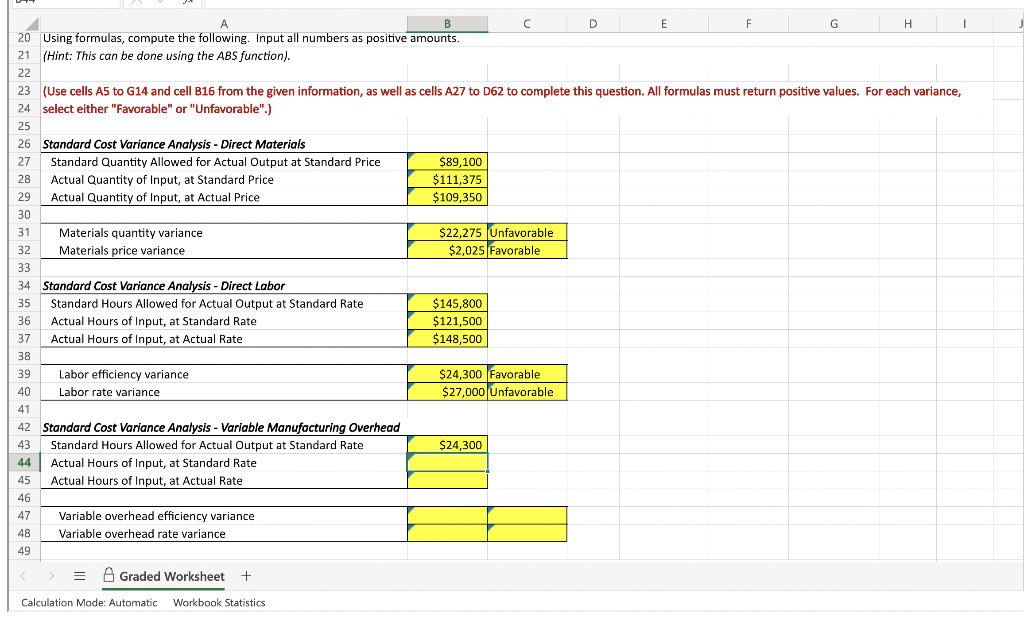
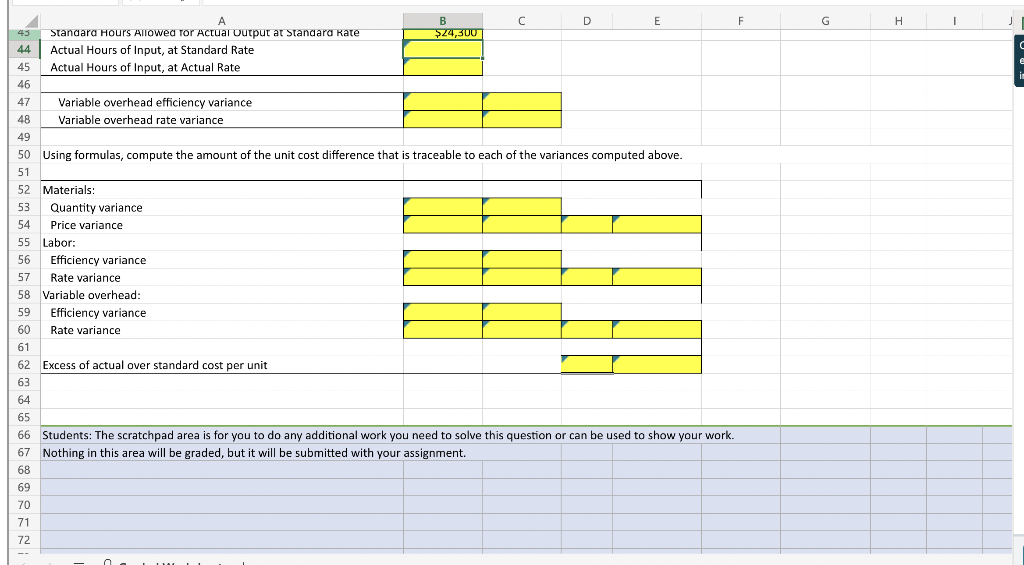
Actual production for the month 13,500 units Variable overhead is assigned to products based on direct labor hours. There was no beginning or ending inventory of materials for the month. Required: Using formulas, compute the following. Input all numbers as positive amounts. (Hint: This can be done using the ABS function). (Use cells A5 to G14 and cell B16 from the given information, as well as cells A27 to D62 to complete this question. All formulas must return positive values. For each variance, select either "Favorable" or "Unfavorable".) Standard Cost Variance Analysis - Direct Materials \begin{tabular}{l|r|} \hline Standard Quantity Allowed for Actual Output at Standard Price & $89,100 \\ \hline Actual Quantity of Input, at Standard Price & $111,375 \\ \hline Actual Quantity of Input, at Actual Price & $109,350 \\ \hline \end{tabular} 20 Using formulas, compute the following. Input all numbers as positive amounts. (Hint: This can be done using the ABS function). (Use cells A5 to G14 and cell B16 from the given information, as well as cells A27 to D62 to complete this question. All formulas must return positive values. For each variance, select either "Favorable" or "Unfavorable".) Standard Cost Variance Analysis - Direct Materials \begin{tabular}{l|r|} \hline Standard Quantity Allowed for Actual Output at Standard Price & $89,100 \\ \cline { 2 - 2 } Actual Quantity of Input, at Standard Price & $111,375 \\ \cline { 2 - 2 } Actual Quantity of Input, at Actual Price & $109,350 \\ \hline \end{tabular} \begin{tabular}{l|r|l|} \hline Materials quantity variance & $22,275 & Unfavorable \\ \cline { 2 - 3 } Materials price variance & $2,025 & Favorable \\ \hline \end{tabular} Standard Cost Variance Analysis - Direct Labor \begin{tabular}{|l|r|} \hline Standard Hours Allowed for Actual Output at Standard Rate & $145,800 \\ \hline Actual Hours of Input, at Standard Rate & $121,500 \\ \hline Actual Hours of Input, at Actual Rate & $148,500 \\ \hline \end{tabular} \begin{tabular}{|l|r|l|} \hline Labor efficiency variance & $24,300 & Favorable \\ \hline Labor rate variance & $27,000 & Unfavorable \\ \hline \end{tabular} Standard Cost Variance Analysis - Variable Manufacturing Overhead \begin{tabular}{|l|r|} \hline Standard Hours Allowed for Actual Output at Standard Rate & $24,300 \\ \hline Actual Hours of Input, at Standard Rate & \\ Actual Hours of Input, at Actual Rate & \\ \hline \end{tabular} Variable overhead efficiency variance Variable overhead rate variance GradedWorksheet+ Calculation Mode: Automatic Workbook Statistics Using formulas, compute the amount of the unit cost difference that is traceable to each of the variances computed above. Materials: Quantity variance Price variance Labor: Efficiency variance Rate variance Variable overhead: Efficiency variance Rate variance Excess of actual over standard cost per unit Students: The scratchpad area is for you to do any additional work you need to solve this question or can be used to show your work. Nothing in this area will be graded, but it will be submitted with your assignment
Step by Step Solution
There are 3 Steps involved in it

Get step-by-step solutions from verified subject matter experts