

Question: Please only help with parts d, e, and f. A city provides police protection for two neighborhoods: one rich and one poor. The city receives
Please only help with parts d, e, and f.
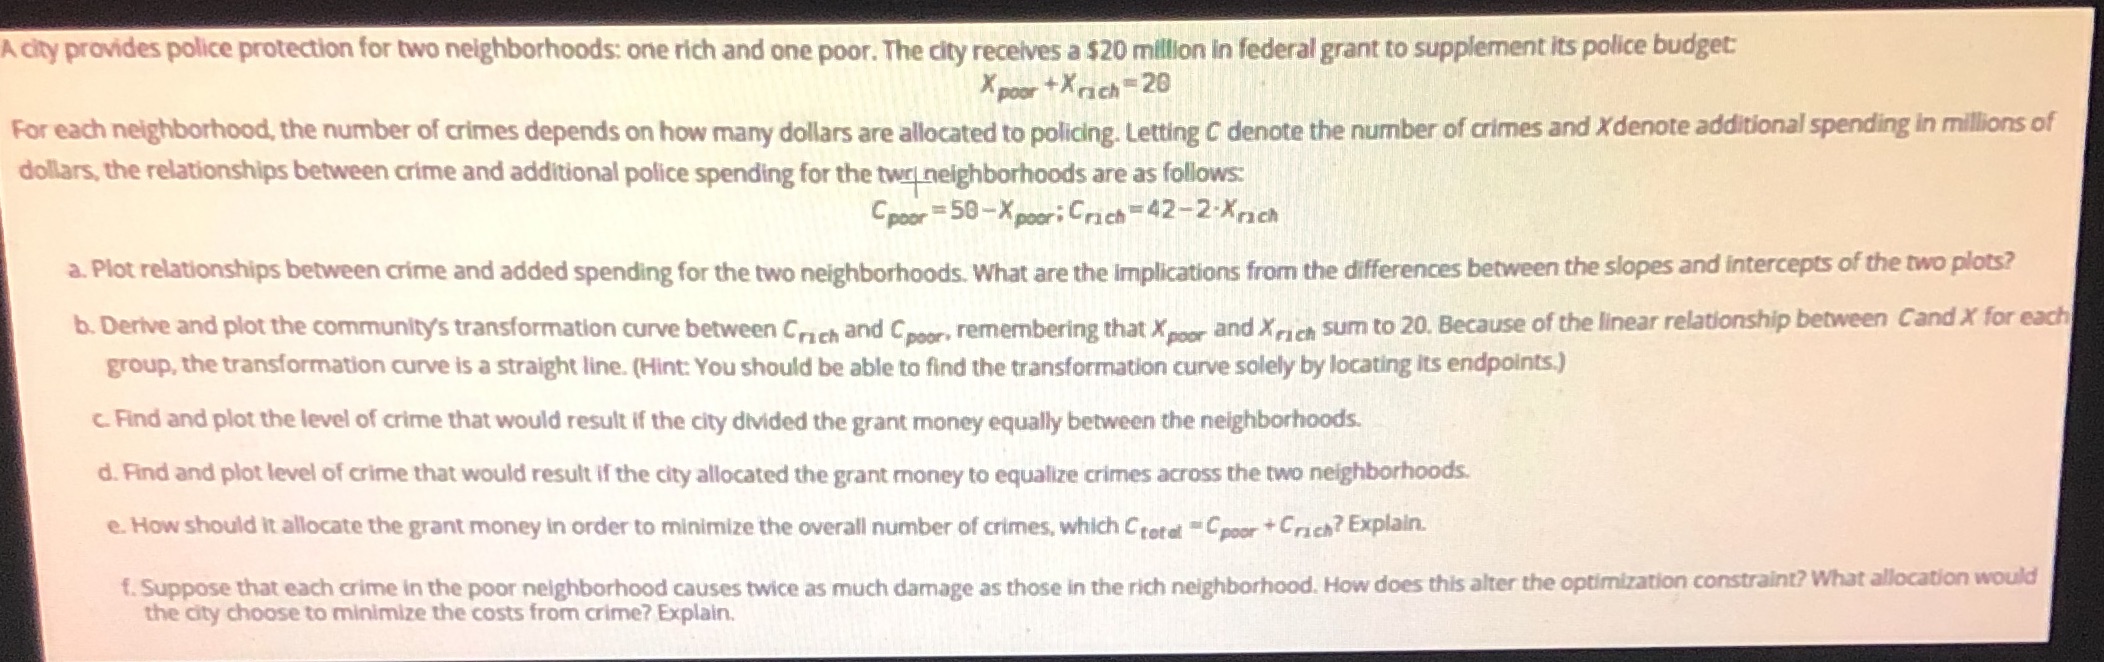
A city provides police protection for two neighborhoods: one rich and one poor. The city receives a $20 million in federal grant to supplement its police budget: Xpoor +Xrich =20 For each neighborhood, the number of crimes depends on how many dollars are allocated to policing. Letting C denote the number of crimes and X denote additional spending in millions of dollars, the relationships between crime and additional police spending for the twry neighborhoods are as follows: Cpoor -50-X poor: Crich - 42-2-Xrach a. Plot relationships between crime and added spending for the two neighborhoods. What are the implications from the differences between the slopes and intercepts of the two plots? b. Derive and plot the community's transformation curve between Crich and Cpoor, remembering that Xpoor and Xrich sum to 20. Because of the linear relationship between Cand X for each group, the transformation curve is a straight line. (Hint: You should be able to find the transformation curve solely by locating its endpoints.) c. Find and plot the level of crime that would result if the city divided the grant money equally between the neighborhoods. d. Find and plot level of crime that would result if the city allocated the grant money to equalize crimes across the two neighborhoods. e. How should it allocate the grant money in order to minimize the overall number of crimes, which Crotal "Cpoor + Crick? Explain. f. Suppose that each crime in the poor neighborhood causes twice as much damage as those in the rich neighborhood. How does this alter the optimization constraint? What allocation would the city choose to minimize the costs from crime? Explain
Step by Step Solution
There are 3 Steps involved in it

Get step-by-step solutions from verified subject matter experts