

Question: PLEASE ONLY SOLVE 3.4 USING R PROGRAMMING LANGUAGE, 3.3 IS FOR REFERENCE PLEASE ONLY SOLVE 3.4 USING R PROGRAMMING LANGUAGE, 3.3 IS FOR REFERENCE PLEASE
PLEASE ONLY SOLVE 3.4 USING R PROGRAMMING LANGUAGE, 3.3 IS FOR REFERENCE
PLEASE ONLY SOLVE 3.4 USING R PROGRAMMING LANGUAGE, 3.3 IS FOR REFERENCE
PLEASE ONLY SOLVE 3.4 USING R PROGRAMMING LANGUAGE, 3.3 IS FOR REFERENCE
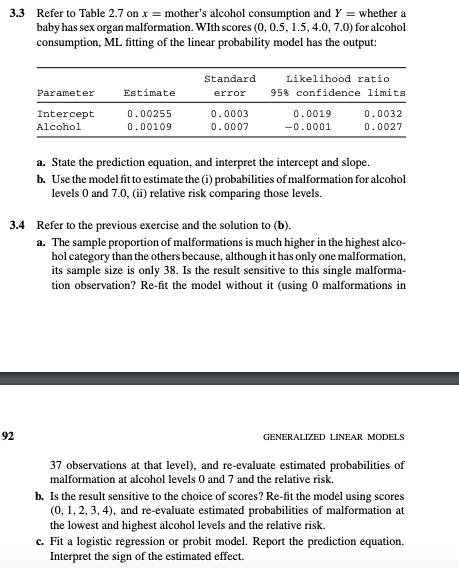
3.3 Refer to Table 2.7 on x mother's alcohol consumption and Y-whether a baby has sex organ malformation. WIth scores (0, 0.5, 1.5, 4.0, 7.0) for alcohol consumption, ML fitting of the linear probability model has the output: Standard Likelihood ratio 95% confidence limits Parameter Estimate Intercept Alcohol 0.00255 0.00109 0.0003 0.0007 0.0019 -0.0001 0.0032 0.0027 State the prediction equation, and interpret the intercept and slope. Use the model fitto estimate the (i) probabilities of malformation for alcohol levels 0 and 7.0, (ii) relative risk comparing those levels. a. b. 3.4 Refer to the previous exercise and the solution to (b). a. The sample proportion of malformations is much higher in the highest alco- hol category than the others because, although it has only one malformation, its sample size is only 38. Is the result sensitive to this single malforma- tion observation? Re-fit the model without it (using 0 malformations in 92 GENERALIZED LINEAR MODELS 37 observations at that level), and re-evaluate estimated probabilities of malformation at alcohol levels 0 and 7 and the relative risk b. Is the result sensitive to the choice of scores? Re-fit the model using scores (0, 1, 2, 3, 4), and re-evaluate estimated probabilities of malformation at the lowest and highest alcohol levels and the relative risk. c. Fit a logistic regression or probit model. Report the prediction equation. Interpret the sign of the estimated effect. 3.3 Refer to Table 2.7 on x mother's alcohol consumption and Y-whether a baby has sex organ malformation. WIth scores (0, 0.5, 1.5, 4.0, 7.0) for alcohol consumption, ML fitting of the linear probability model has the output: Standard Likelihood ratio 95% confidence limits Parameter Estimate Intercept Alcohol 0.00255 0.00109 0.0003 0.0007 0.0019 -0.0001 0.0032 0.0027 State the prediction equation, and interpret the intercept and slope. Use the model fitto estimate the (i) probabilities of malformation for alcohol levels 0 and 7.0, (ii) relative risk comparing those levels. a. b. 3.4 Refer to the previous exercise and the solution to (b). a. The sample proportion of malformations is much higher in the highest alco- hol category than the others because, although it has only one malformation, its sample size is only 38. Is the result sensitive to this single malforma- tion observation? Re-fit the model without it (using 0 malformations in 92 GENERALIZED LINEAR MODELS 37 observations at that level), and re-evaluate estimated probabilities of malformation at alcohol levels 0 and 7 and the relative risk b. Is the result sensitive to the choice of scores? Re-fit the model using scores (0, 1, 2, 3, 4), and re-evaluate estimated probabilities of malformation at the lowest and highest alcohol levels and the relative risk. c. Fit a logistic regression or probit model. Report the prediction equation. Interpret the sign of the estimated effect
Step by Step Solution
There are 3 Steps involved in it

Get step-by-step solutions from verified subject matter experts