

Question: Please open the image in a new tab for zoomed in version Ten annual returns are listed in the following table: - 19.9% 16.6% 18.0%
Please open the image in a new tab for zoomed in version
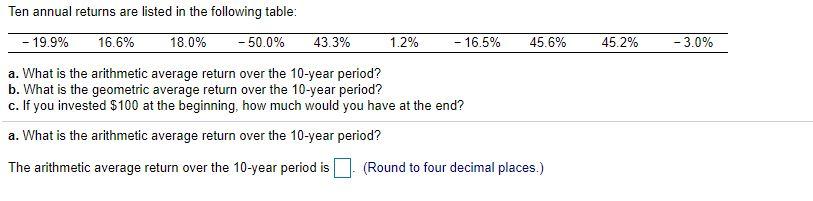
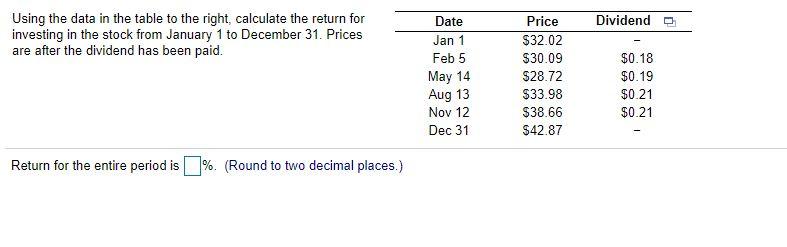
Ten annual returns are listed in the following table: - 19.9% 16.6% 18.0% -50.0% 43.3% 1.2% - 16.5% 45.6% 45.2% - 3.0% a. What is the arithmetic average return over the 10-year period? b. What is the geometric average return over the 10-year period? c. If you invested $100 at the beginning, how much would you have at the end? a. What is the arithmetic average return over the 10-year period? The arithmetic average return over the 10-year period is (Round to four decimal places.) Dividend Using the data in the table to the right, calculate the return for investing in the stock from January 1 to December 31. Prices are after the dividend has been paid. Date Jan 1 Feb 5 May 14 Aug 13 Nov 12 Dec 31 Price $32.02 $30.09 $28.72 $33.98 $38.66 $42.87 $0.18 $0.19 $0.21 $0.21 Return for the entire period is %. (Round to two decimal places.)
Step by Step Solution
There are 3 Steps involved in it

Get step-by-step solutions from verified subject matter experts