

Question: please paste in a organized manner A regression analysis is performed using data for 30 single-family homes to predict appraised value (in thousands of dollars)
please paste in a organized manner
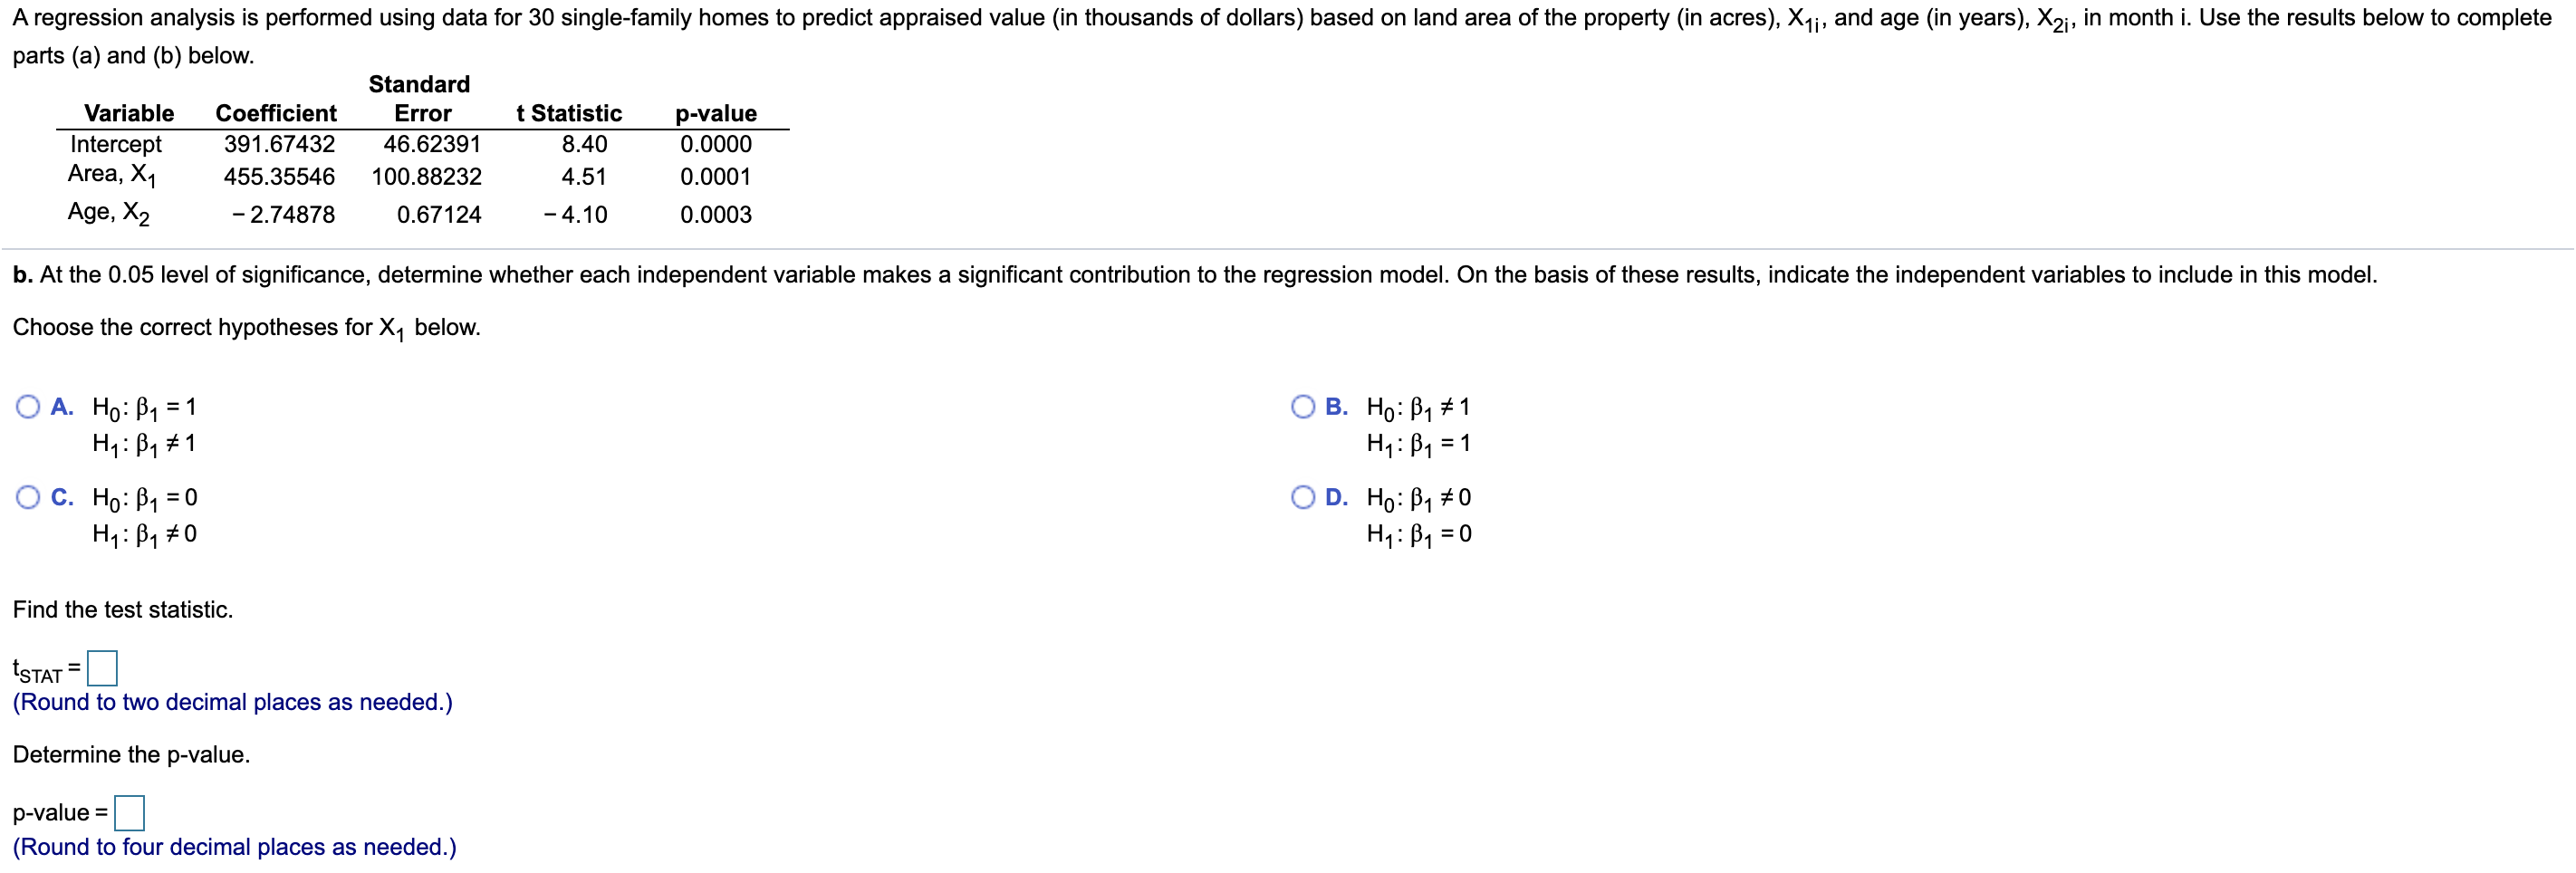
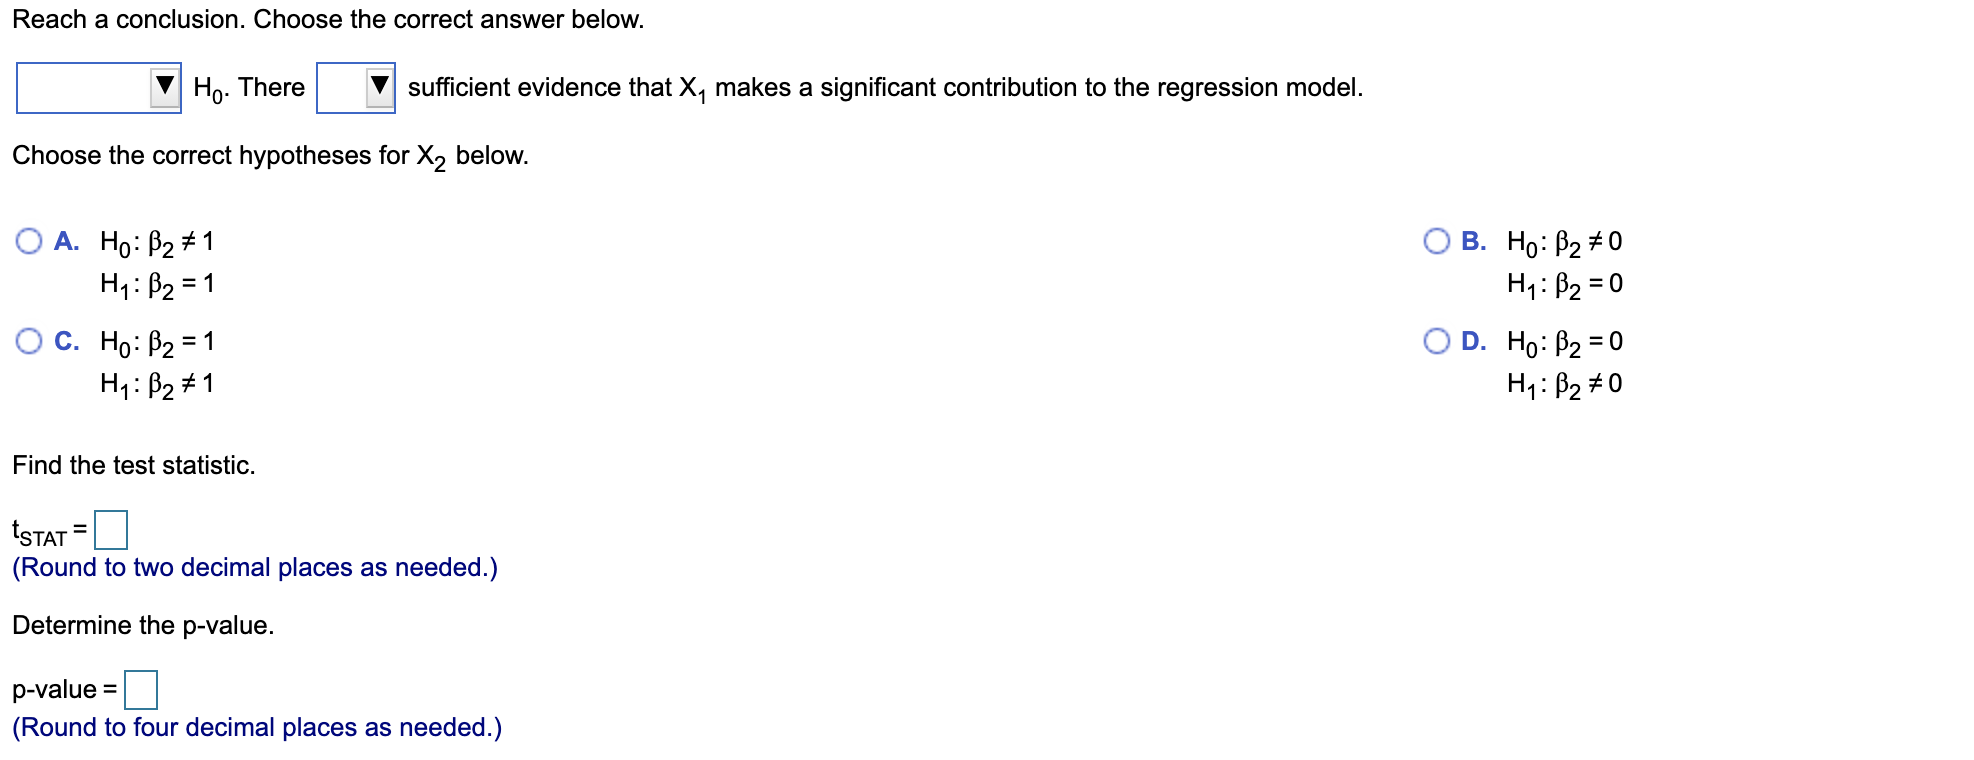
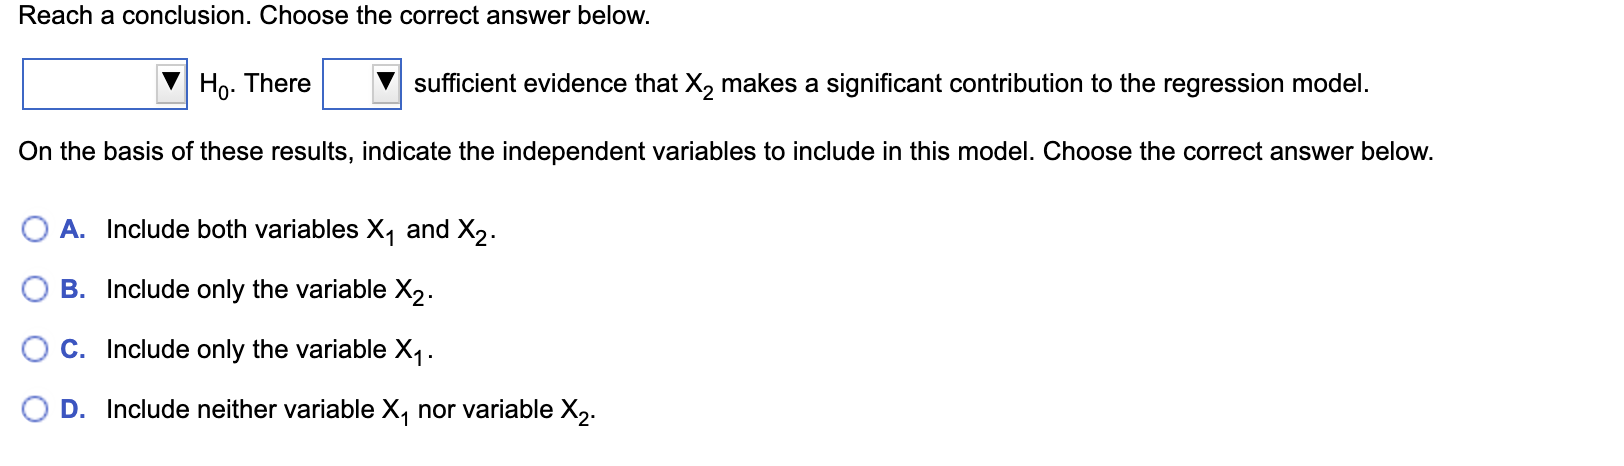
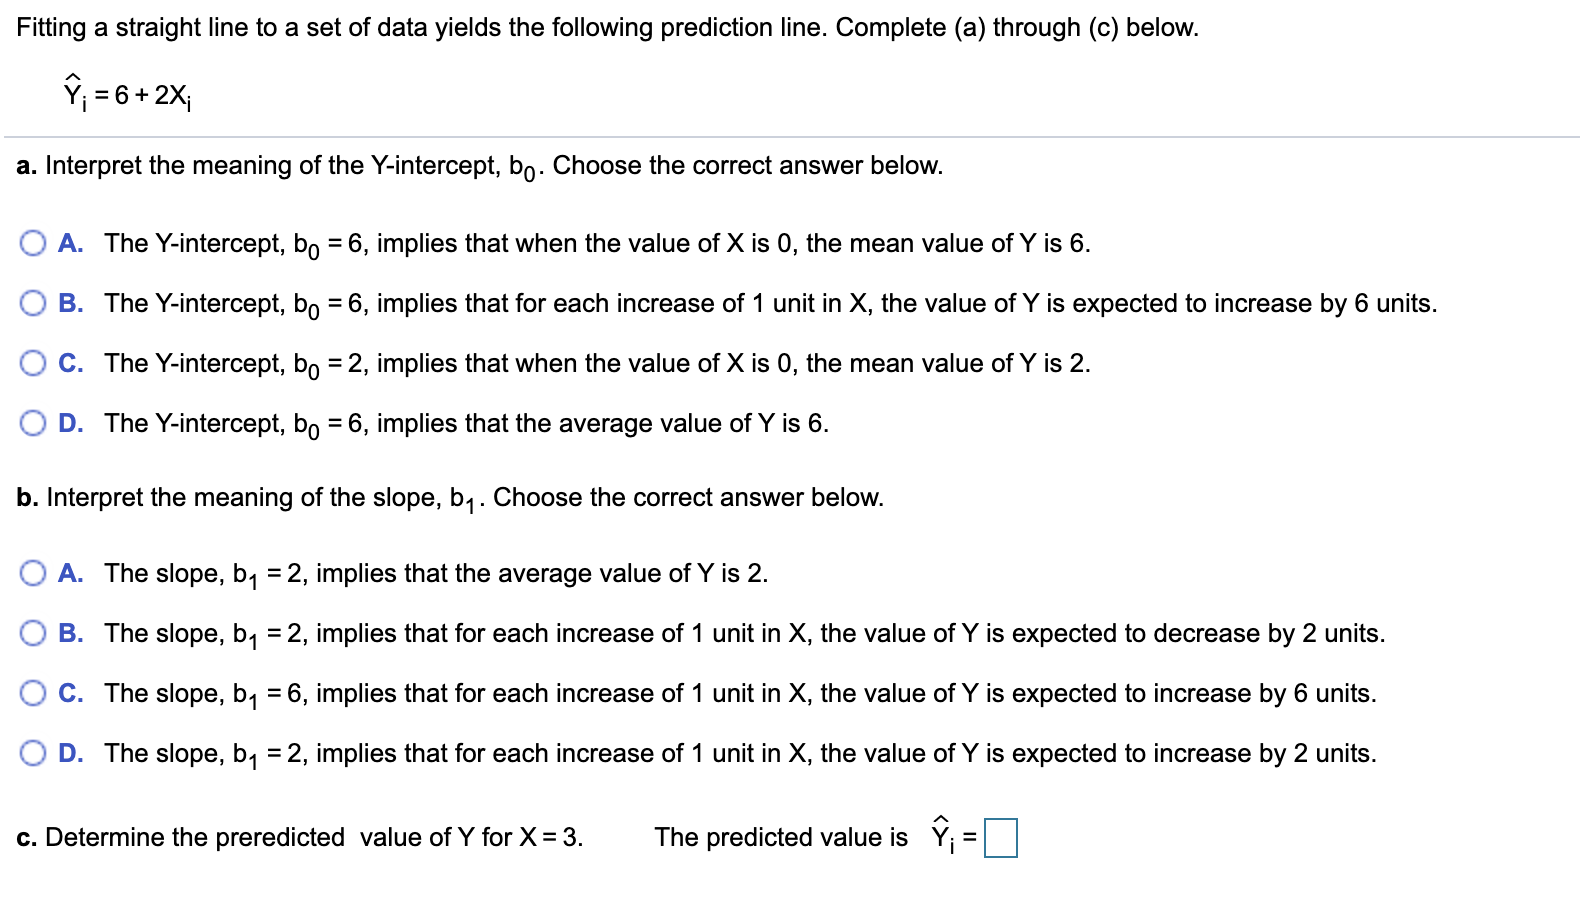
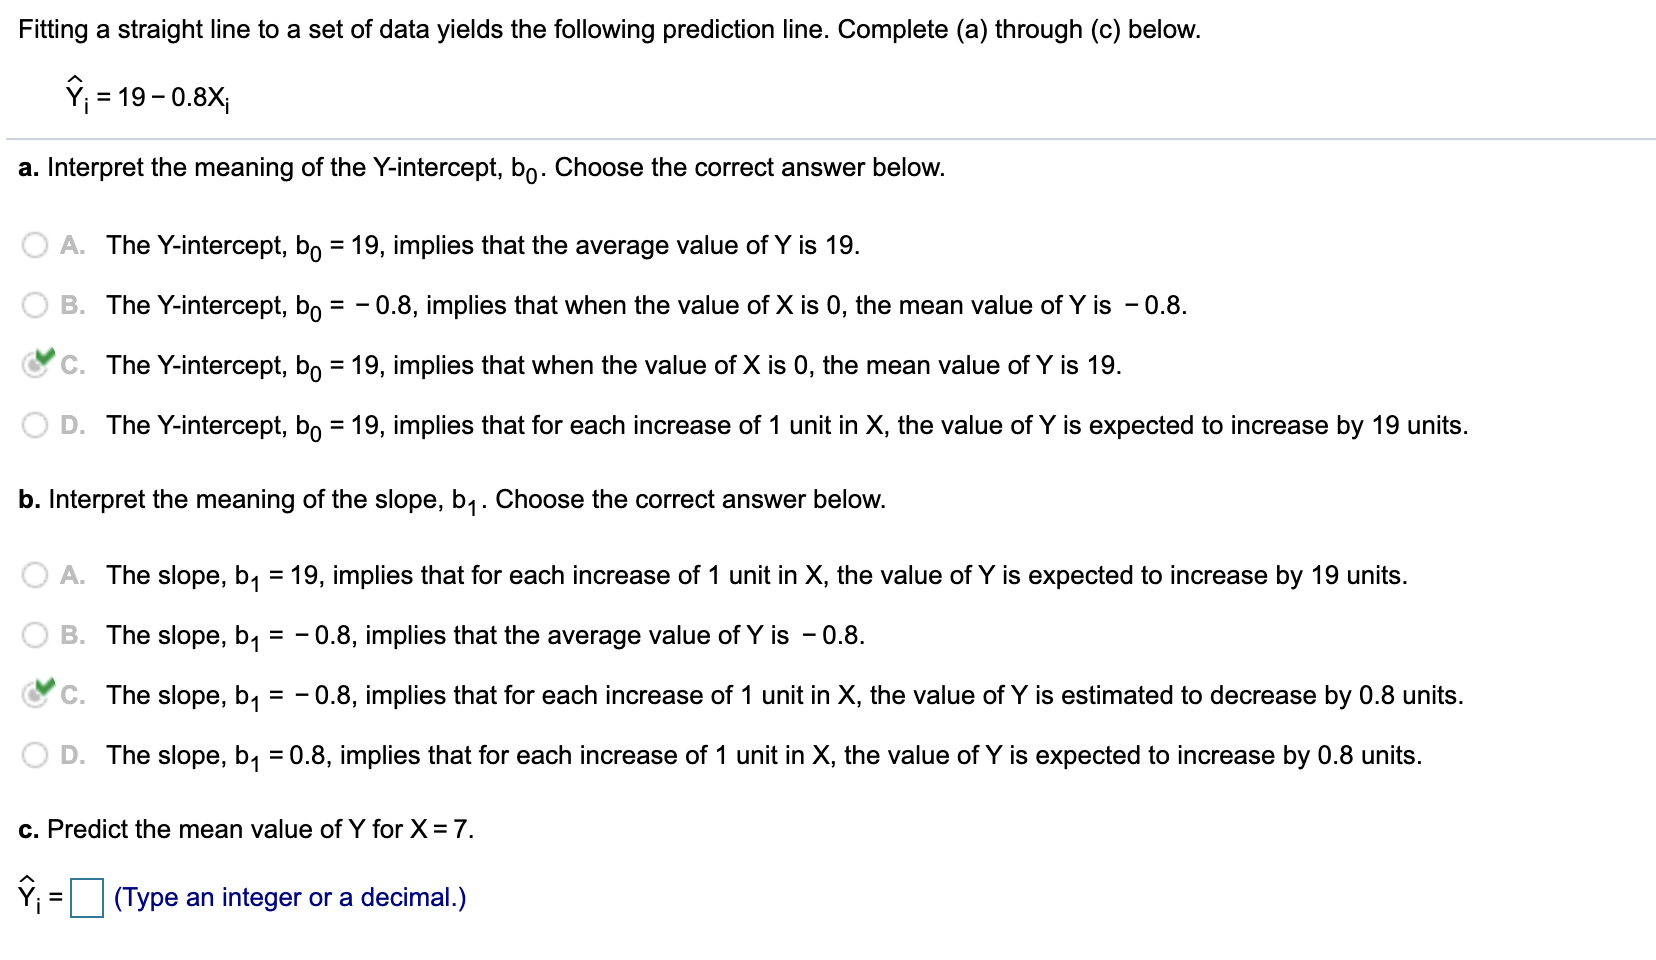
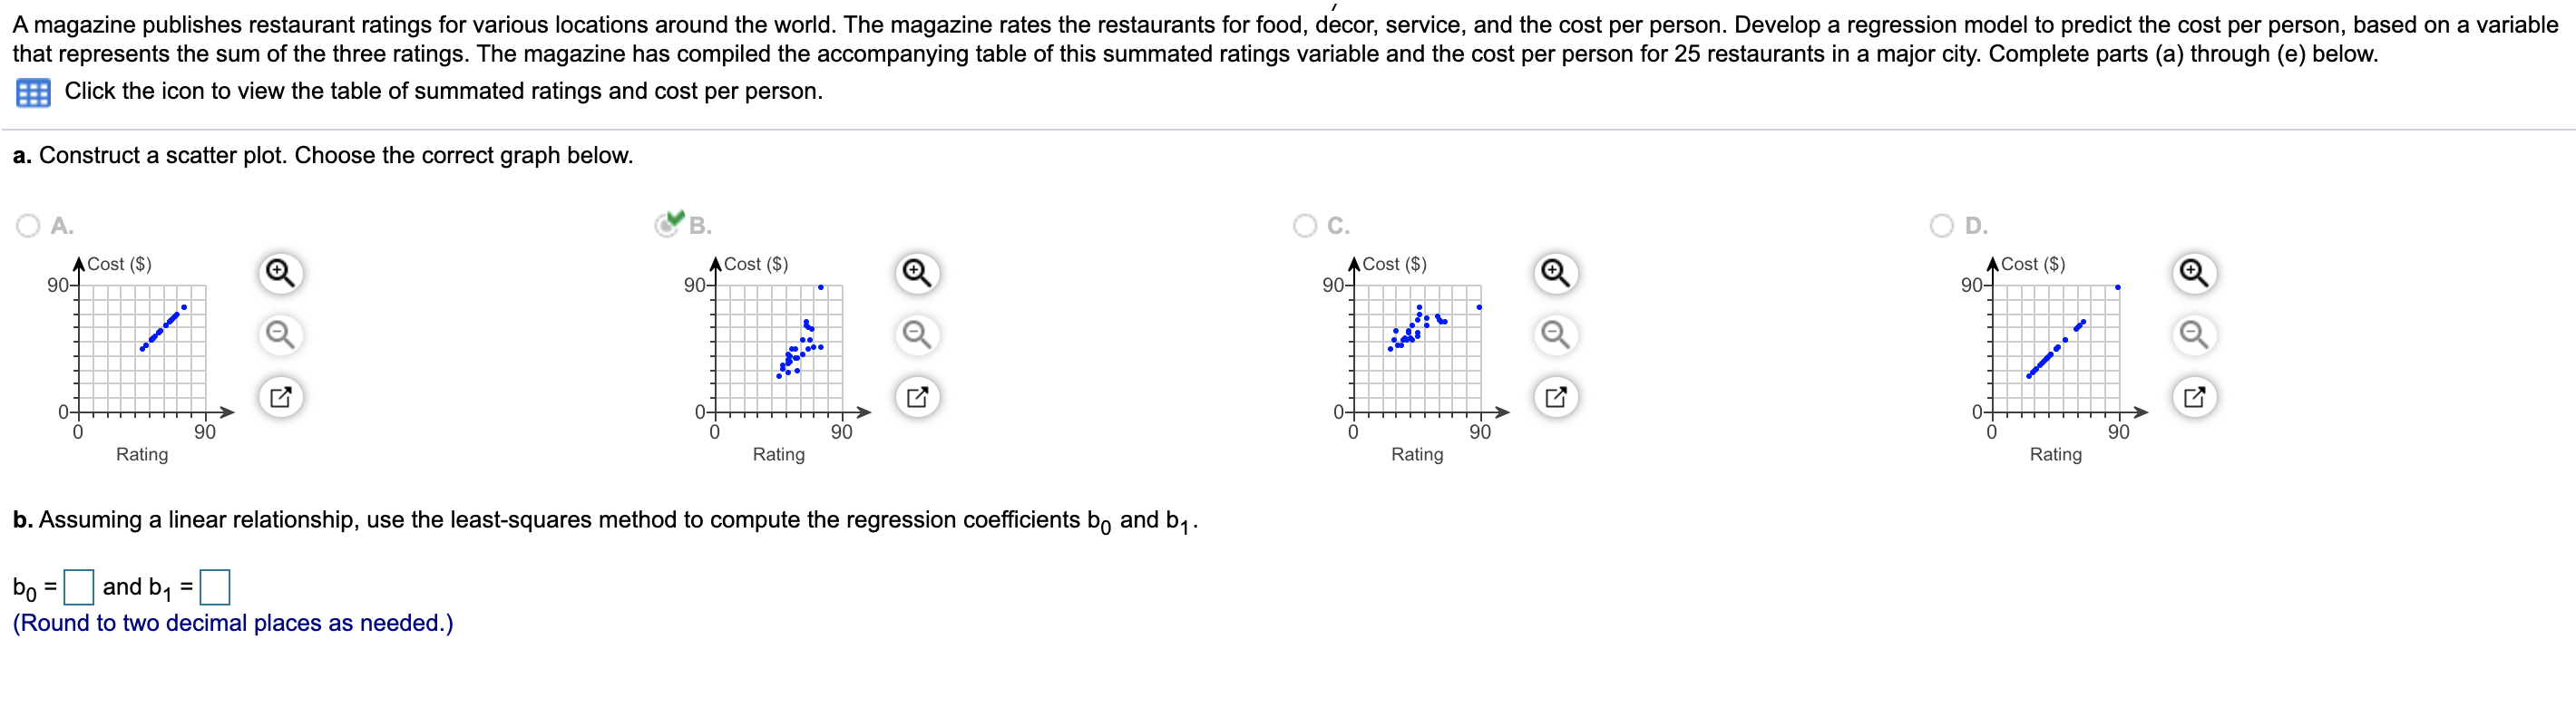
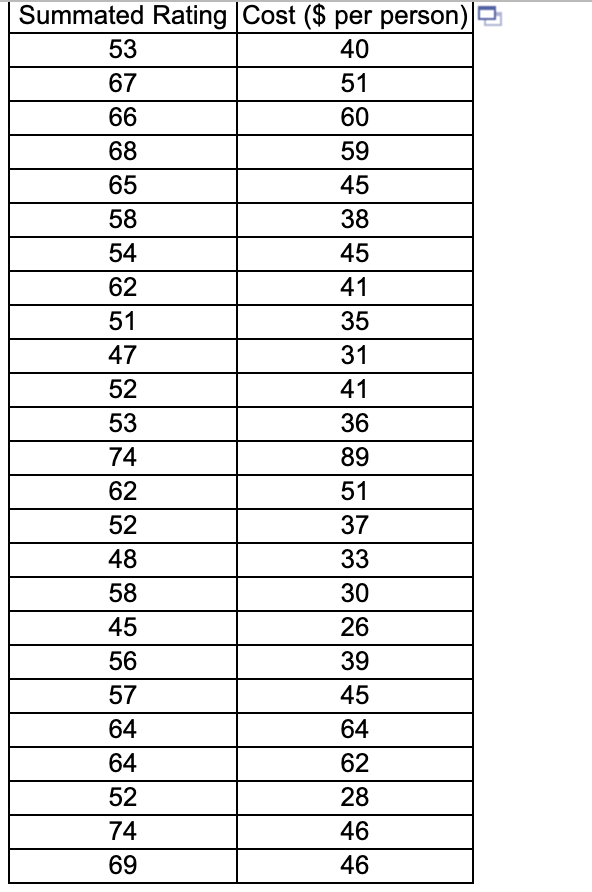
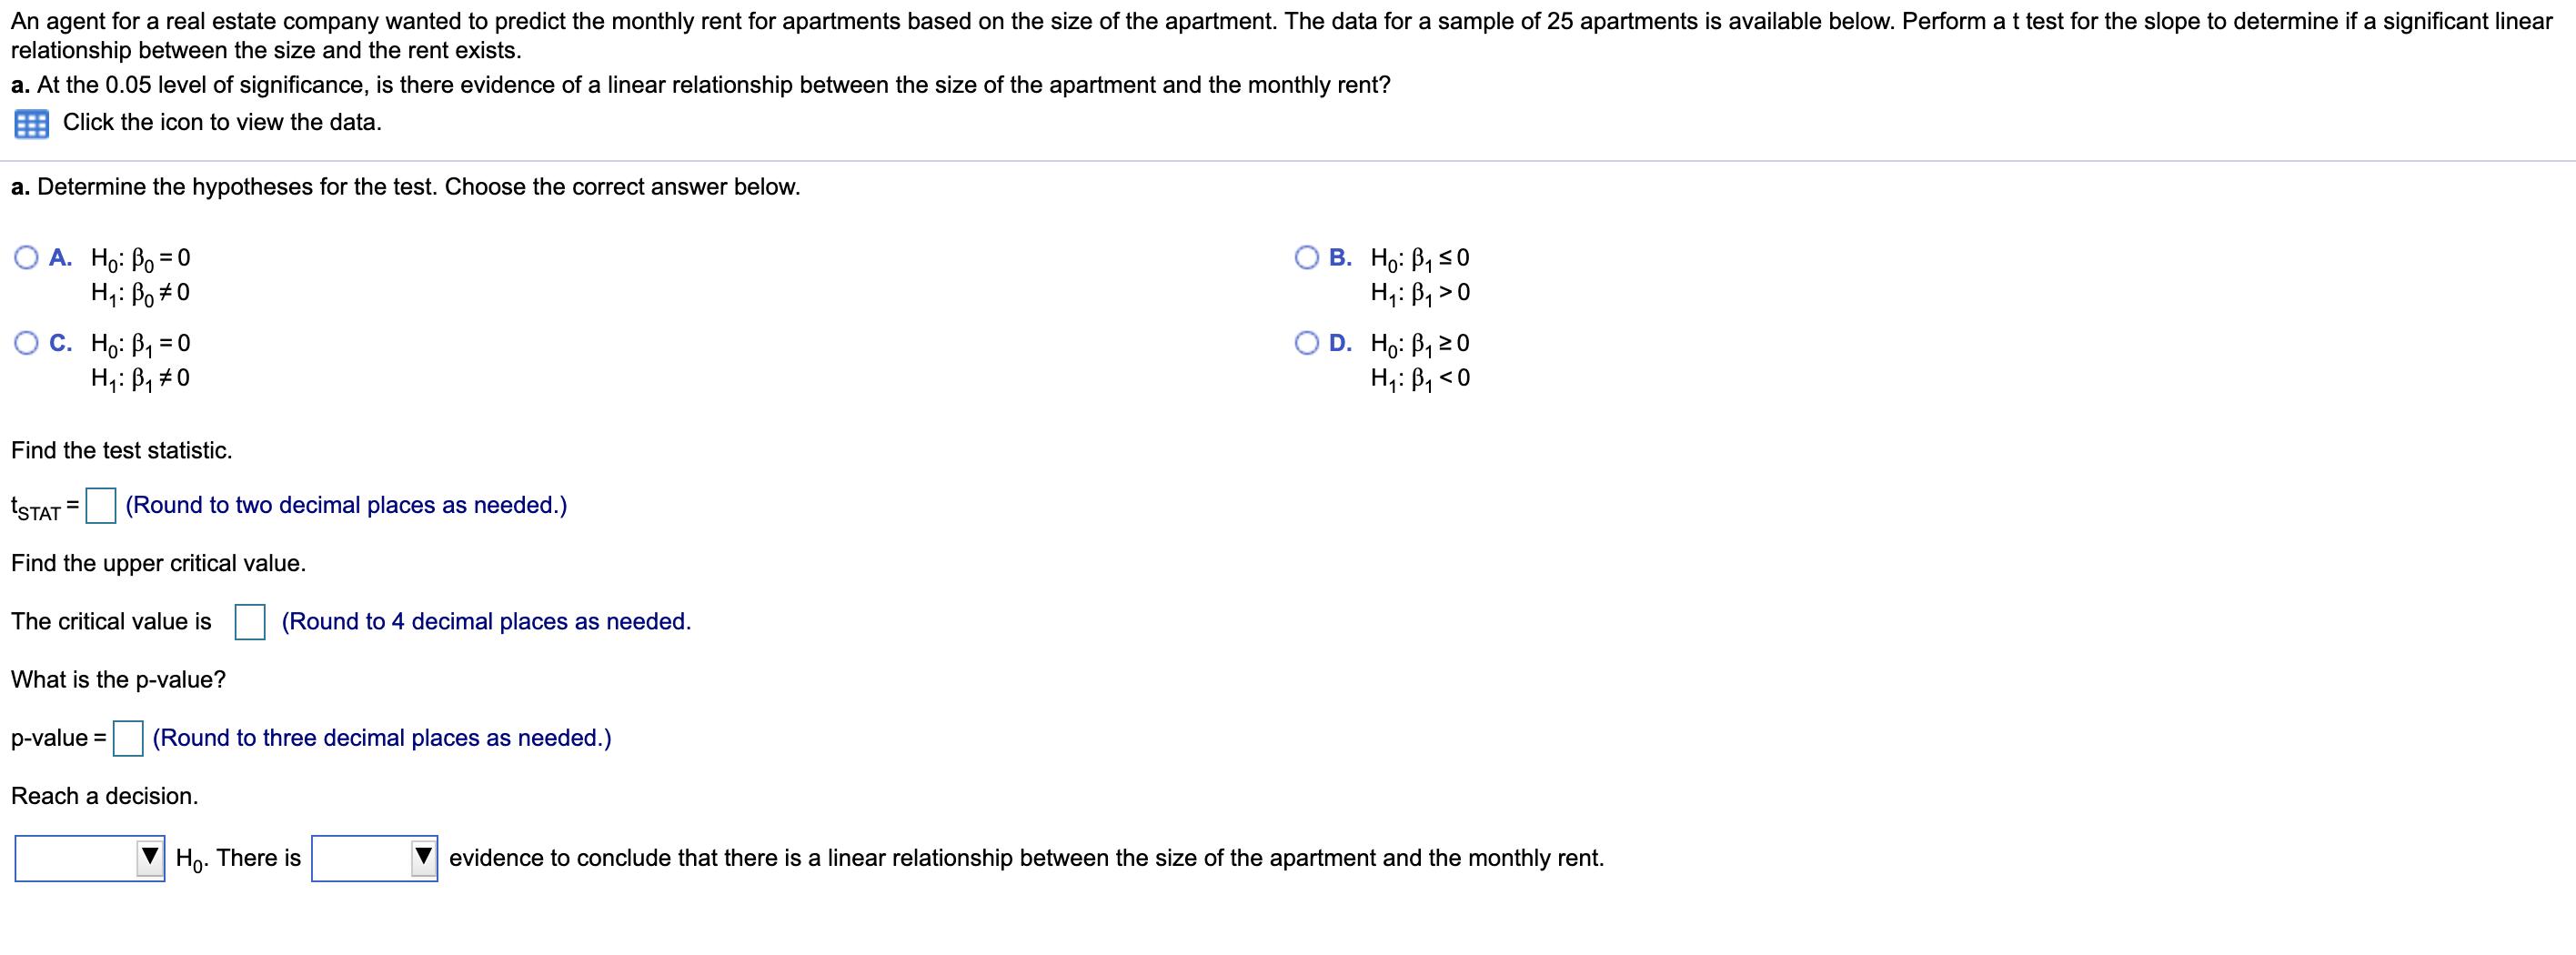
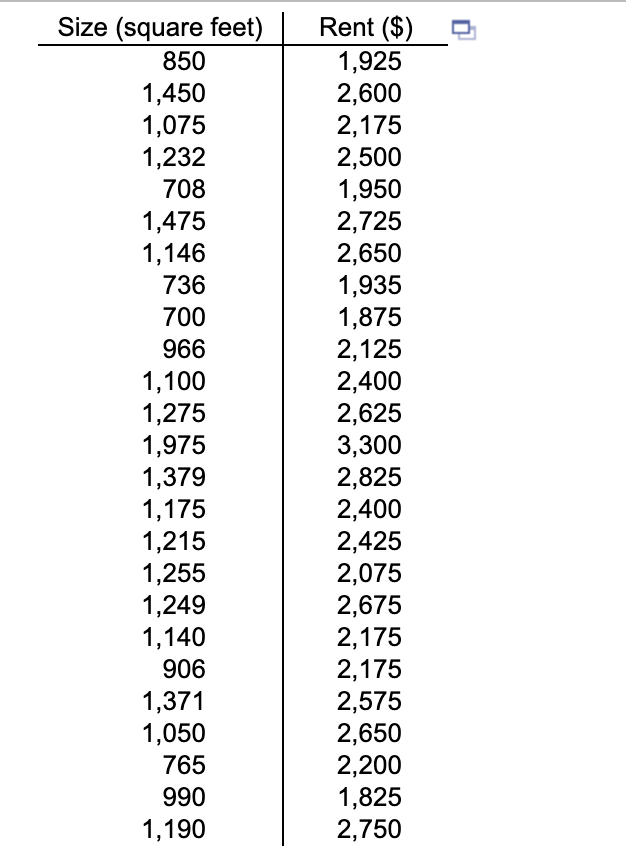
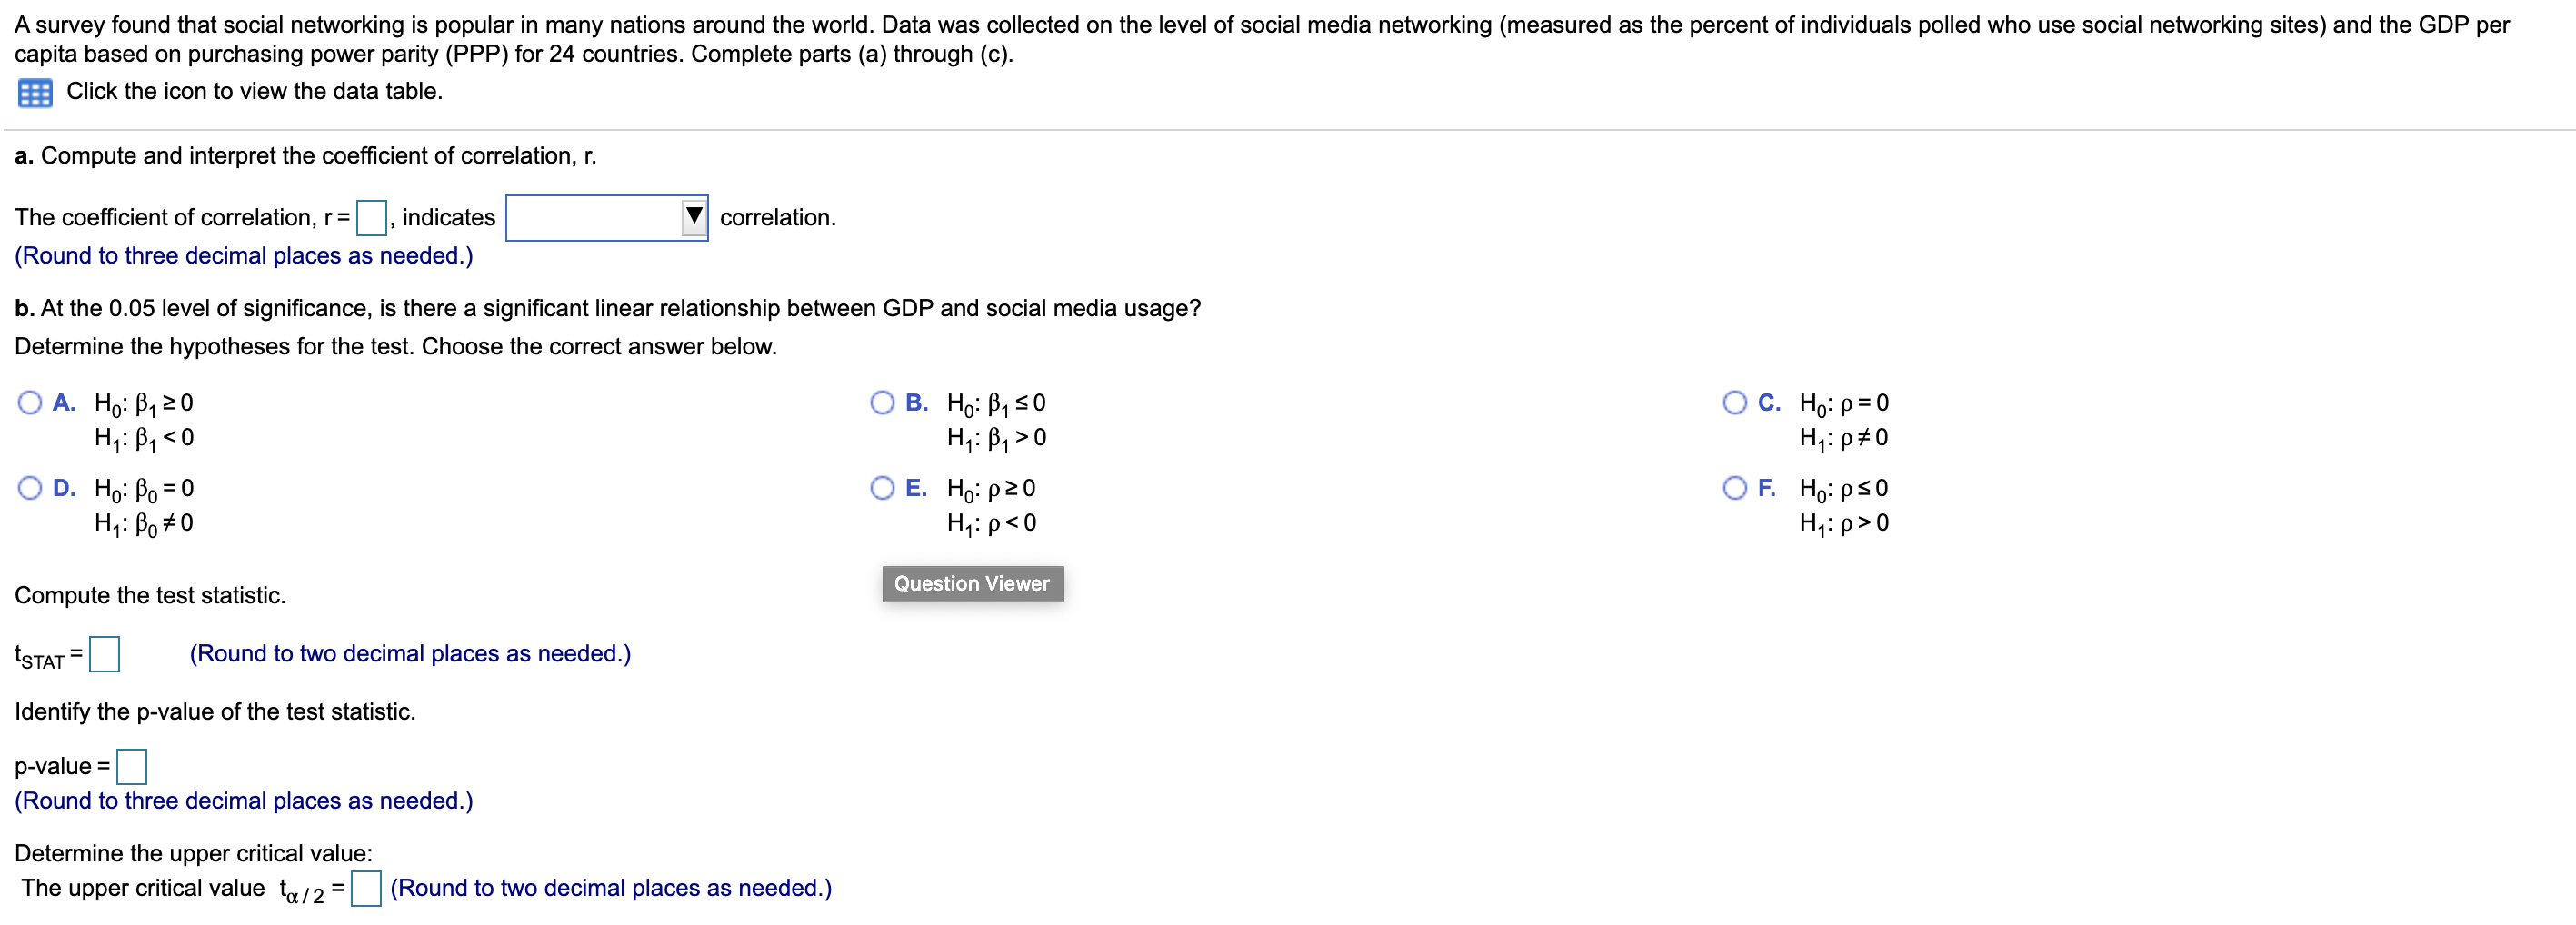
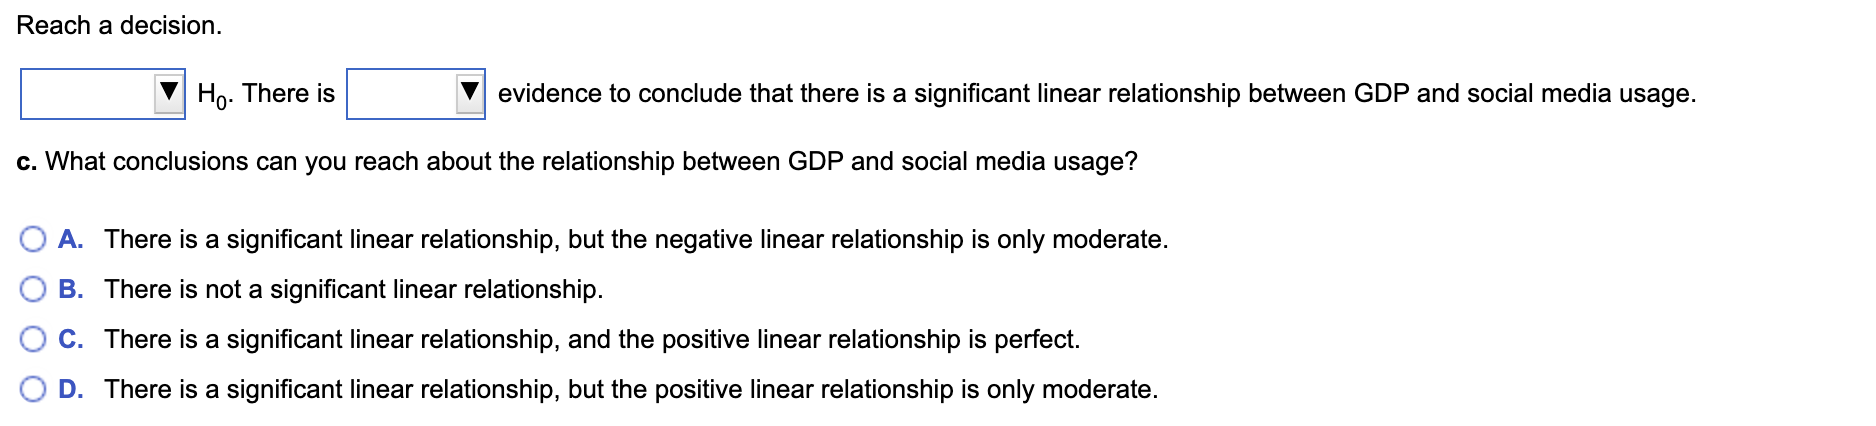
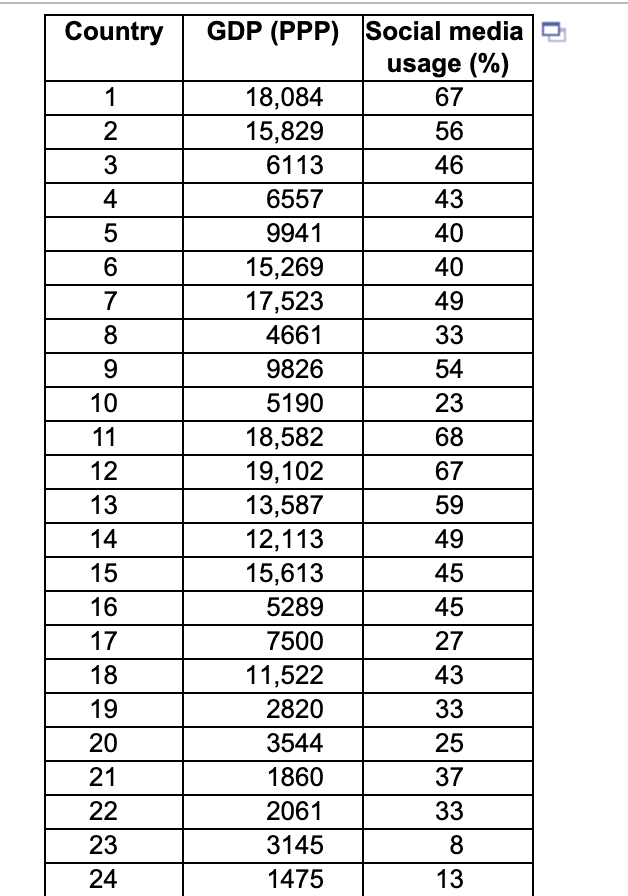

A regression analysis is performed using data for 30 single-family homes to predict appraised value (in thousands of dollars) based on land area of the property (in acres), X1;, and age (in years), X2;, in month i. Use the results below to complete parts (a) and (b) below. Standard Variable Coefficient Error t Statistic p-value Intercep 391.67432 46.62391 3.40 0.0000 Area, X1 455.35546 100.88232 4.51 0.0001 Age, X2 - 2.74878 0.67124 -4.10 0.0003 b. At the 0.05 level of significance, determine whether each independent variable makes a significant contribution to the regression model. On the basis of these results, indicate the independent variables to include in this model. Choose the correct hypotheses for X, below. O A. Ho: B1 = 1 OB. Ho: B1 # 1 Hy : B1 # 1 Hy : B1 = 1 OC. Ho: B1 = 0 OD. HO : B1 # 0 H1 : B1 # 0 H1 : B1 = 0 Find the test statistic. tSTAT = (Round to two decimal places as needed.) Determine the p-value. p-value = (Round to four decimal places as needed.)Reach a conclusion. Choose the correct answer below. Ho. There sufficient evidence that X, makes a significant contribution to the regression model. Choose the correct hypotheses for X2 below. O A. Ho: B2 # 1 OB. Ho: B2 # 0 H1: B2 = 1 H1: B2 = 0 O C. Ho: P2 = 1 OD. Ho: P2 = 0 H1: B2 # 1 H1: B2 # 0 Find the test statistic. STAT (Round to two decimal places as needed.) Determine the p-value. p-value = (Round to four decimal places as needed.)Reach a conclusion. Choose the correct answer below. Ho. There sufficient evidence that X2 makes a significant contribution to the regression model. On the basis of these results, indicate the independent variables to include in this model. Choose the correct answer below. O A. Include both variables X, and X2. O B. Include only the variable X2. O C. Include only the variable X1 . O D. Include neither variable X, nor variable X2-Fitting a straight line to a set of data yields the following prediction line. Complete (a) through (0) below. A Y, = 6 + 2X, a. Interpret the meaning of the Yintercept, b0. Choose the correct answer below. 0 A. The Y-intercept, b0 = 6, implies that when the value of X is 0, the mean value on is 6. O B. The Y-intercept, b0 = 6, implies that for each increase of 1 unit in X, the value of Y is expected to increase by 6 units. 0 C. The Y-intercept, b0 =2, implies that when the value of X is 0, the mean value on is 2. O D. The Y-intercept, b0 = 6, implies that the average value of Y is 6. b. Interpret the meaning of the slope, b1. Choose the correct answer below. 0 A. The slope, b1 = 2, implies that the average value on is 2. O B. The slope. b1 = 2, implies that for each increase of 1 unit in X, the value of Y is expected to decrease by 2 units. 0 C. The slope, b1 = 6, implies that for each increase of 1 unit in X, the value of Y is expected to increase by 6 units. 0 D. The slope, b1 = 2, implies that for each increase of 1 unit in X, the value of Y is expected to increase by 2 units. c. Determine the preredicted value of Y forX= 3. The predicted value is Y, = Cl Fitting a straight line to a set of data yields the following prediction line. Complete (a) through (c) below. A Y, = 19 - 0.8Xi a. Interpret the meaning of the Y-intercept, b0. Choose the correct answer below. A. The Y-intercept, b0 = 19, implies that the average value of Y is 19. B. The Y-intercept, b0 = - 0.8, implies that when the value of X is 0, the mean value of Y is - 0.8. .V C. The Y-intercept, b0 =19, implies that when the value of X is 0, the mean value of Y is 19. D. The Y-intercept, b0 =19, implies that for each increase of 1 unit in X, the value of Y is expected to increase by 19 units. b. Interpret the meaning of the slope. b1. Choose the correct answer below. A. The slope. b1 = 19. implies that for each increase of 1 unit in X, the value on is expected to increase by 19 units. B. The slope, b1 = 0.8, implies that the average value on is - 0.8. .V C. The slope, b1 = 0.8, implies that for each increase of1 unit in X, the value on is estimated to decrease by 0.8 units. D. The slope. b1 = 0.8, implies that for each increase of 1 unit in X, the value of Y is expected to increase by 0.8 units. 6. Predict the mean value of Y for X = T. Y, = Cl (Type an integer or a decimal.) A magazine publishes restaurant ratings for various locations around the world' The magazine rates the restaurants for food, decor. service, and the cost per person. Develop a regression model to predict the cost per person. based on a variable that represents the sum of the three ratings. The magazine has compiled the accompanying table of this summated ratings variable and the cost per person for 25 restaurants in a major city. Complete parts (a) through (e) below. a Click the icon to view the table of summated ratings and oost per person. a. Construct a scatter plot. Choose the correct graph below. b. Assuming a linear relationship, use the least-squares method to compute the regression coefcients b0 and b1. b0 = and bl = (Round to two decimal places as needed') \fAn agent for a real estate company wanted to predict the monthly rent for apartments based on the size of the apartment. The data for a sample of 25 apartments is available below. Perform a ttest for the slope to determine if a signicant linear relationship between the size and the rent exists. a. At the 0.05 level of signicance, is there evidence of a linear relationship between the size of the apartment and the monthly rent? a Click the icon to view the data. a. Determine the hypotheses for the test. Choose the correct answer below. OA. H0:[30=0 OB. Ho:p1so \"1150*o H1:1>0 oc. H01p1=0 on. Ho:[3120 H1391"0 H1:[310 H: p#0 OD. Ho: Bo = 0 OE. Ho: p20 OF. Ho: pso H1 : Po # 0 Hip0 Compute the test statistic. Question Viewer tSTAT = (Round to two decimal places as needed.) Identify the p-value of the test statistic. p-value = (Round to three decimal places as needed.) Determine the upper critical value: The upper critical value to/2 = (Round to two decimal places as needed. )Reach a decision. Ho. There is evidence to conclude that there is a significant linear relationship between GDP and social media usage. c. What conclusions can you reach about the relationship between GDP and social media usage? O A. There is a significant linear relationship, but the negative linear relationship is only moderate. O B. There is not a significant linear relationship. O C. There is a significant linear relationship, and the positive linear relationship is perfect. O D. There is a significant linear relationship, but the positive linear relationship is only moderate.\fA researdner developed a regression model to predict the cost of a meal based on the summated rating (sum of ratings for food, decor, and service) and the cost per meal for 12 restaurants. The results of the study show that b1 = 1.4982 and 5b = 0,1468. 1 a. At the 0.05 level of signicance, is there evidence of a linear relationship between the summated rating of a restaurant and the cost of a meal? b. Construct a 95% condence interval estimate of the population slope, 61. a. Determine the hypotheses for the test. Choose the correct answer below. OA. H0:050 O B. Ho:pozo Oc. H0: 9150 H':|3>0 H':|30 O D. H0: 9120 O E. H0: 91:0 0 F. Ho:po=o H1:B1
Step by Step Solution
There are 3 Steps involved in it

Get step-by-step solutions from verified subject matter experts