

Question: PLEASE PAY CLOSE ATTENTION TO WHAT IS BEING ASKED IN QUESTIONS. I have arrange the questions 1-6, please only provide answer with question number and


PLEASE PAY CLOSE ATTENTION TO WHAT IS BEING ASKED IN QUESTIONS. I have arrange the questions 1-6, please only provide answer with question number and part (ex. 1a, 1b, 2a, 2b, etc.). No explanation needed.
1.

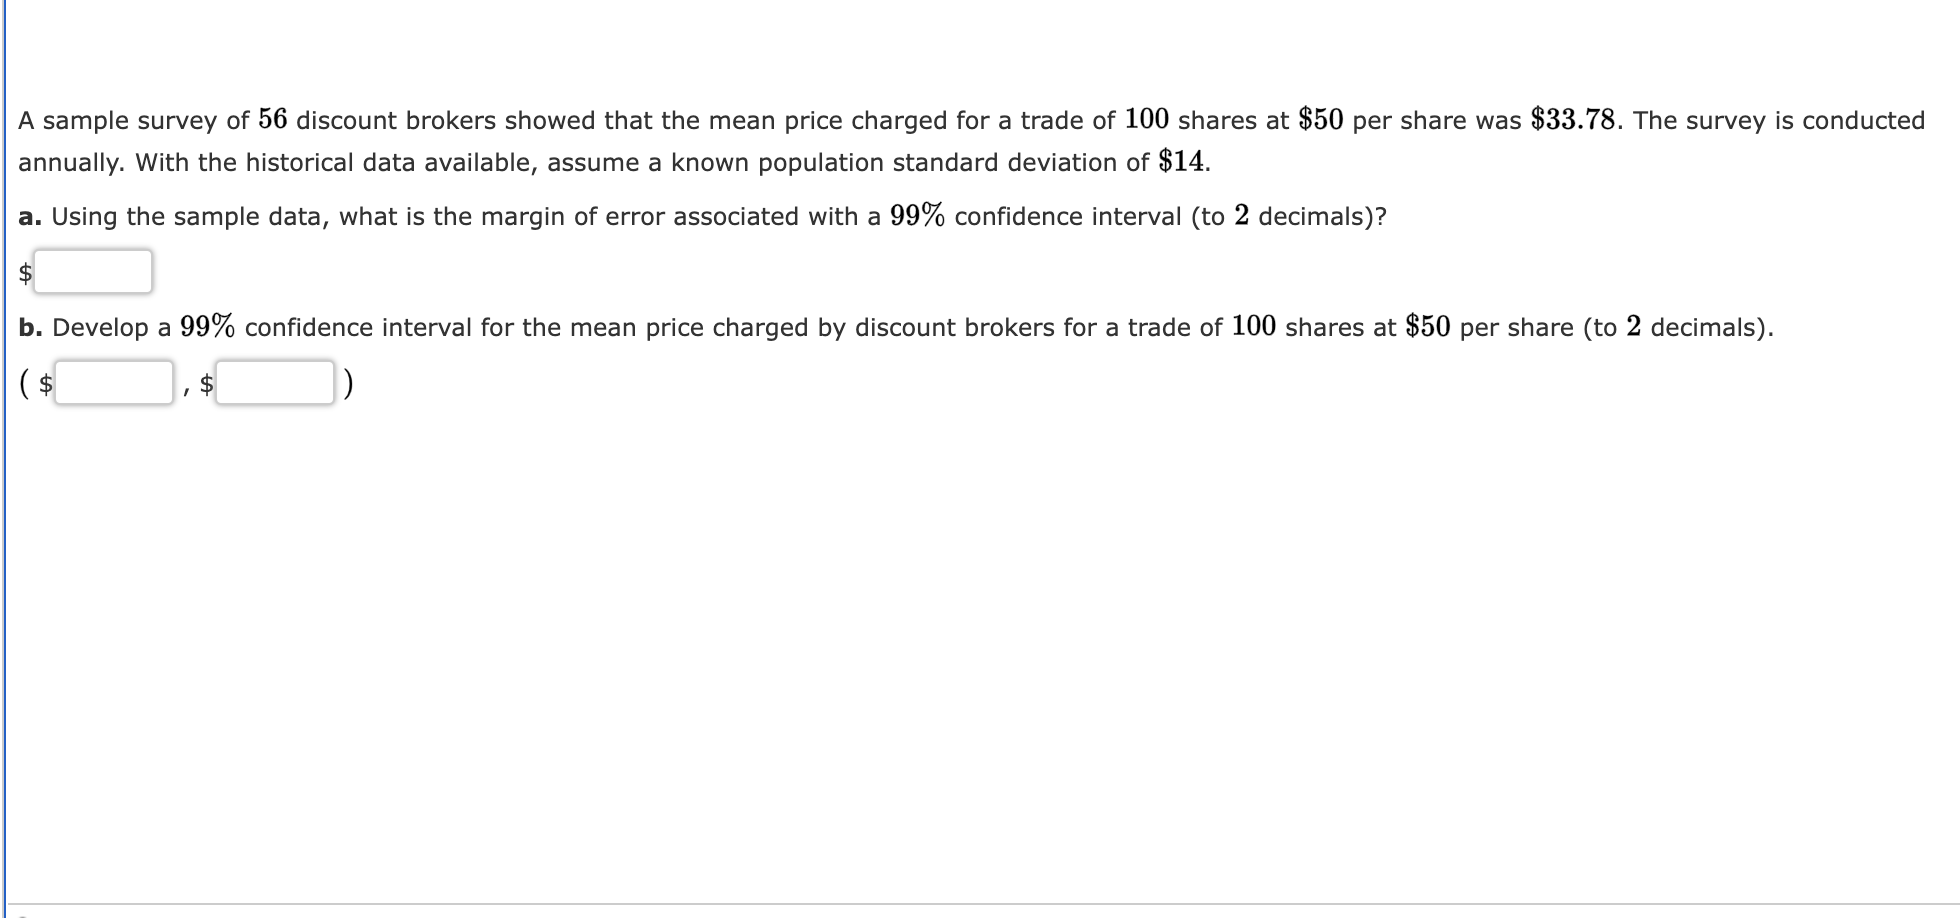
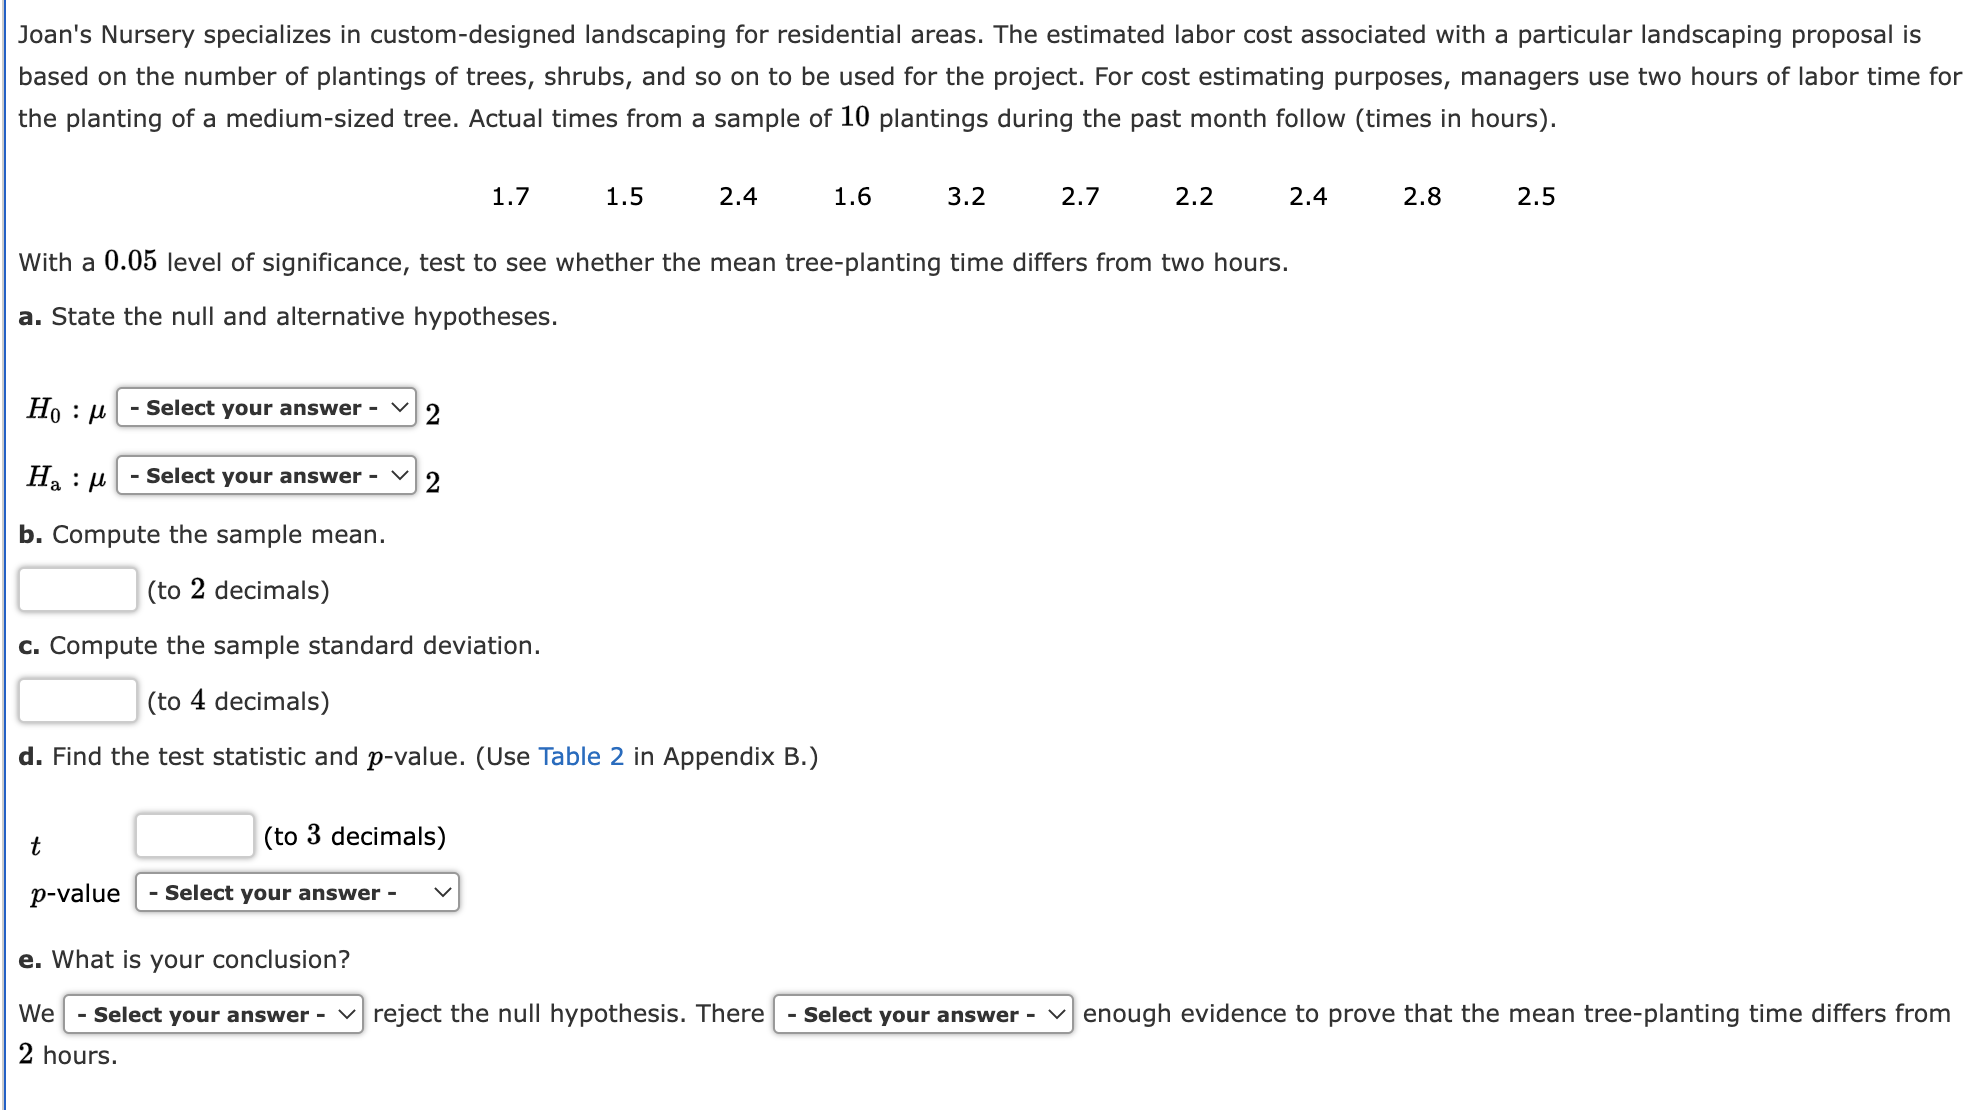
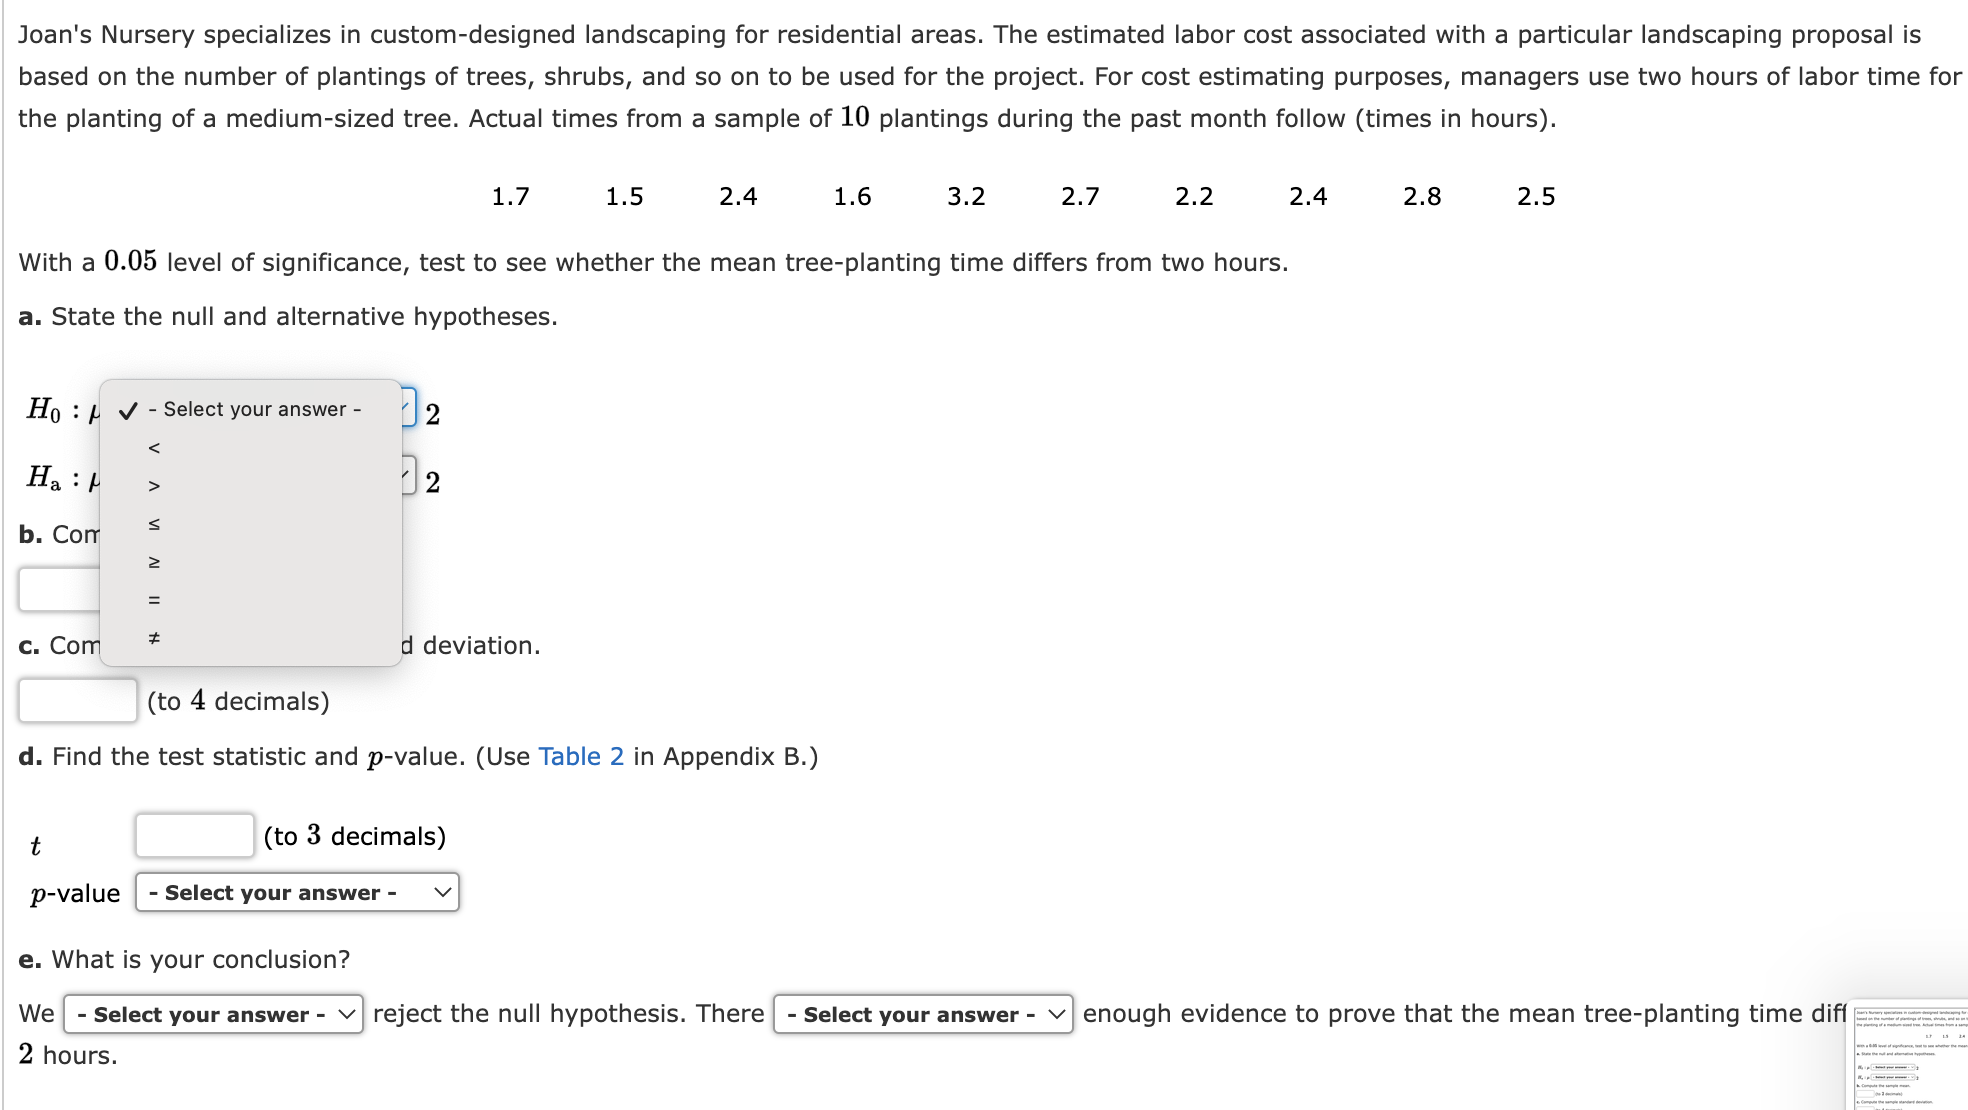
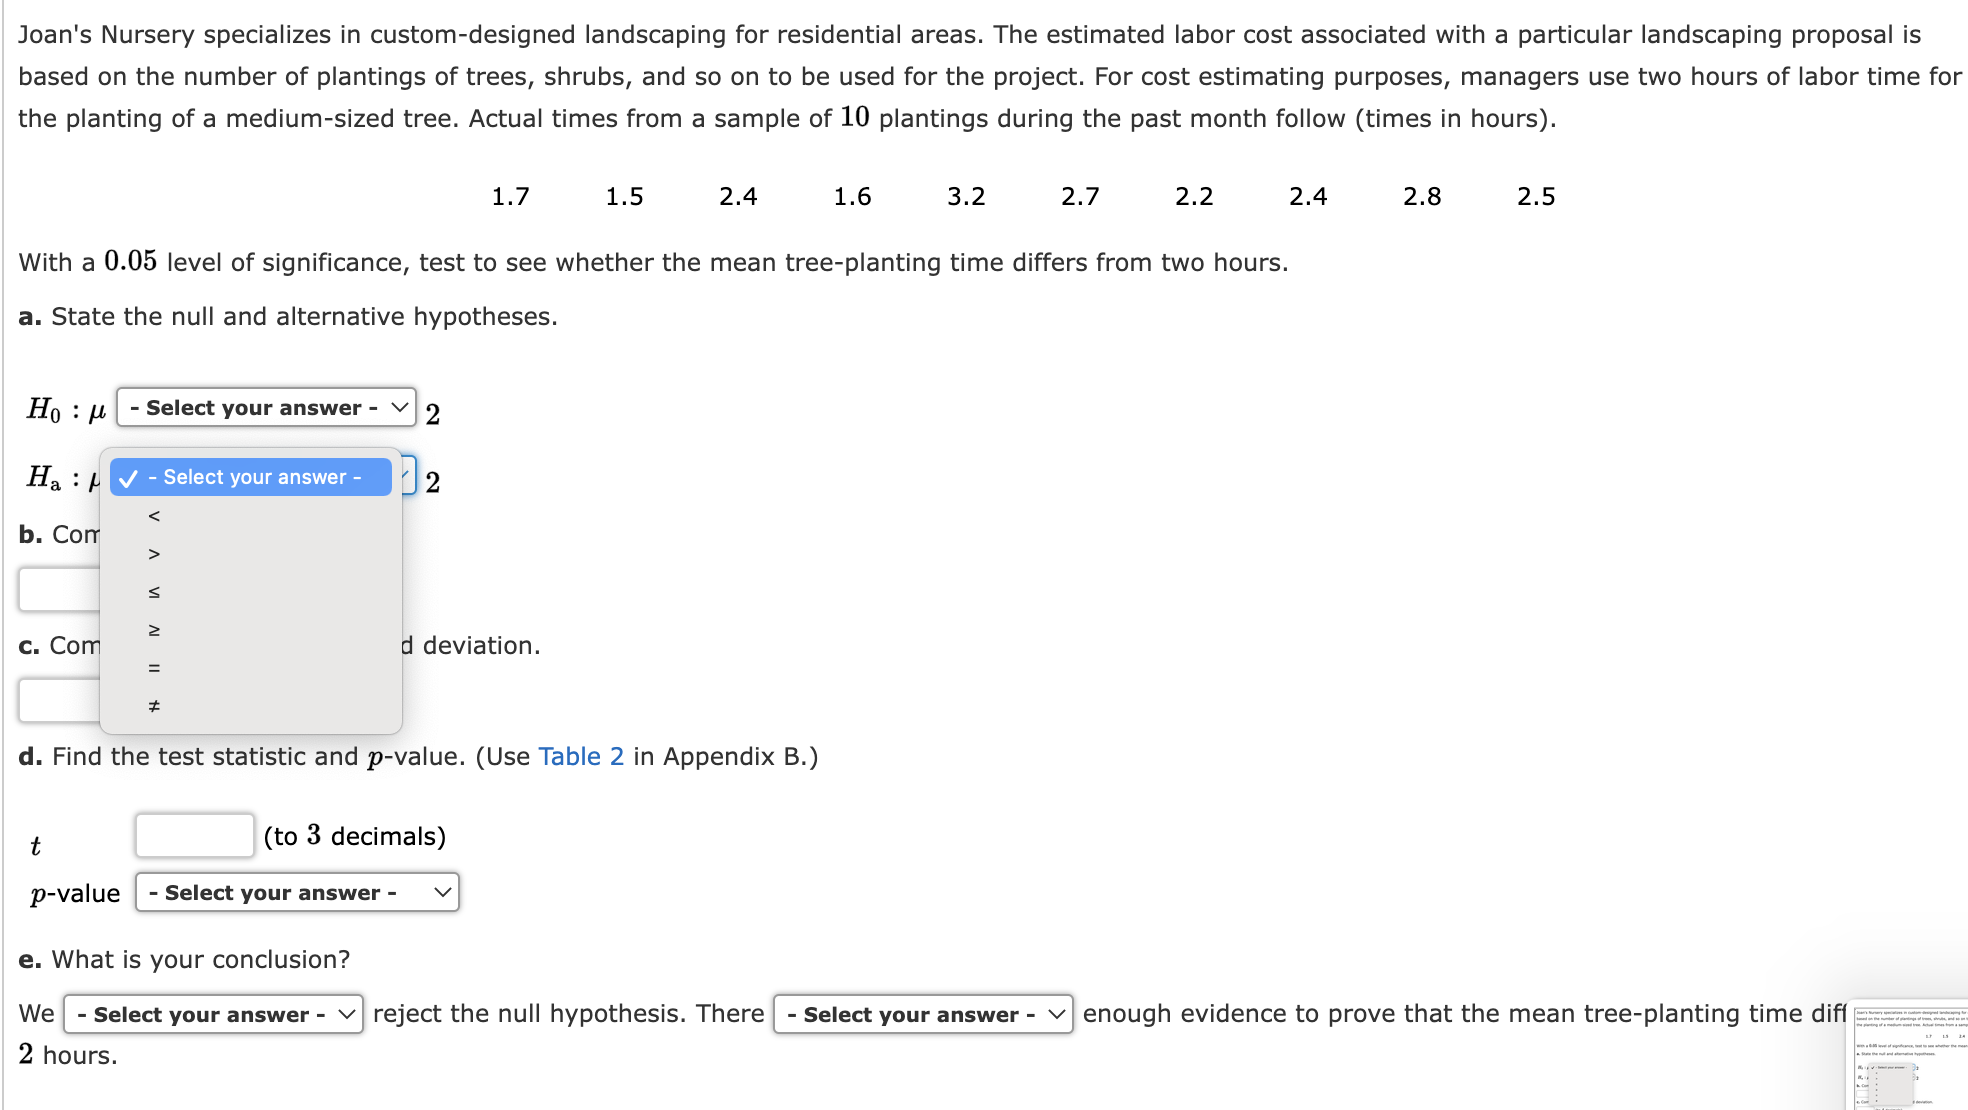
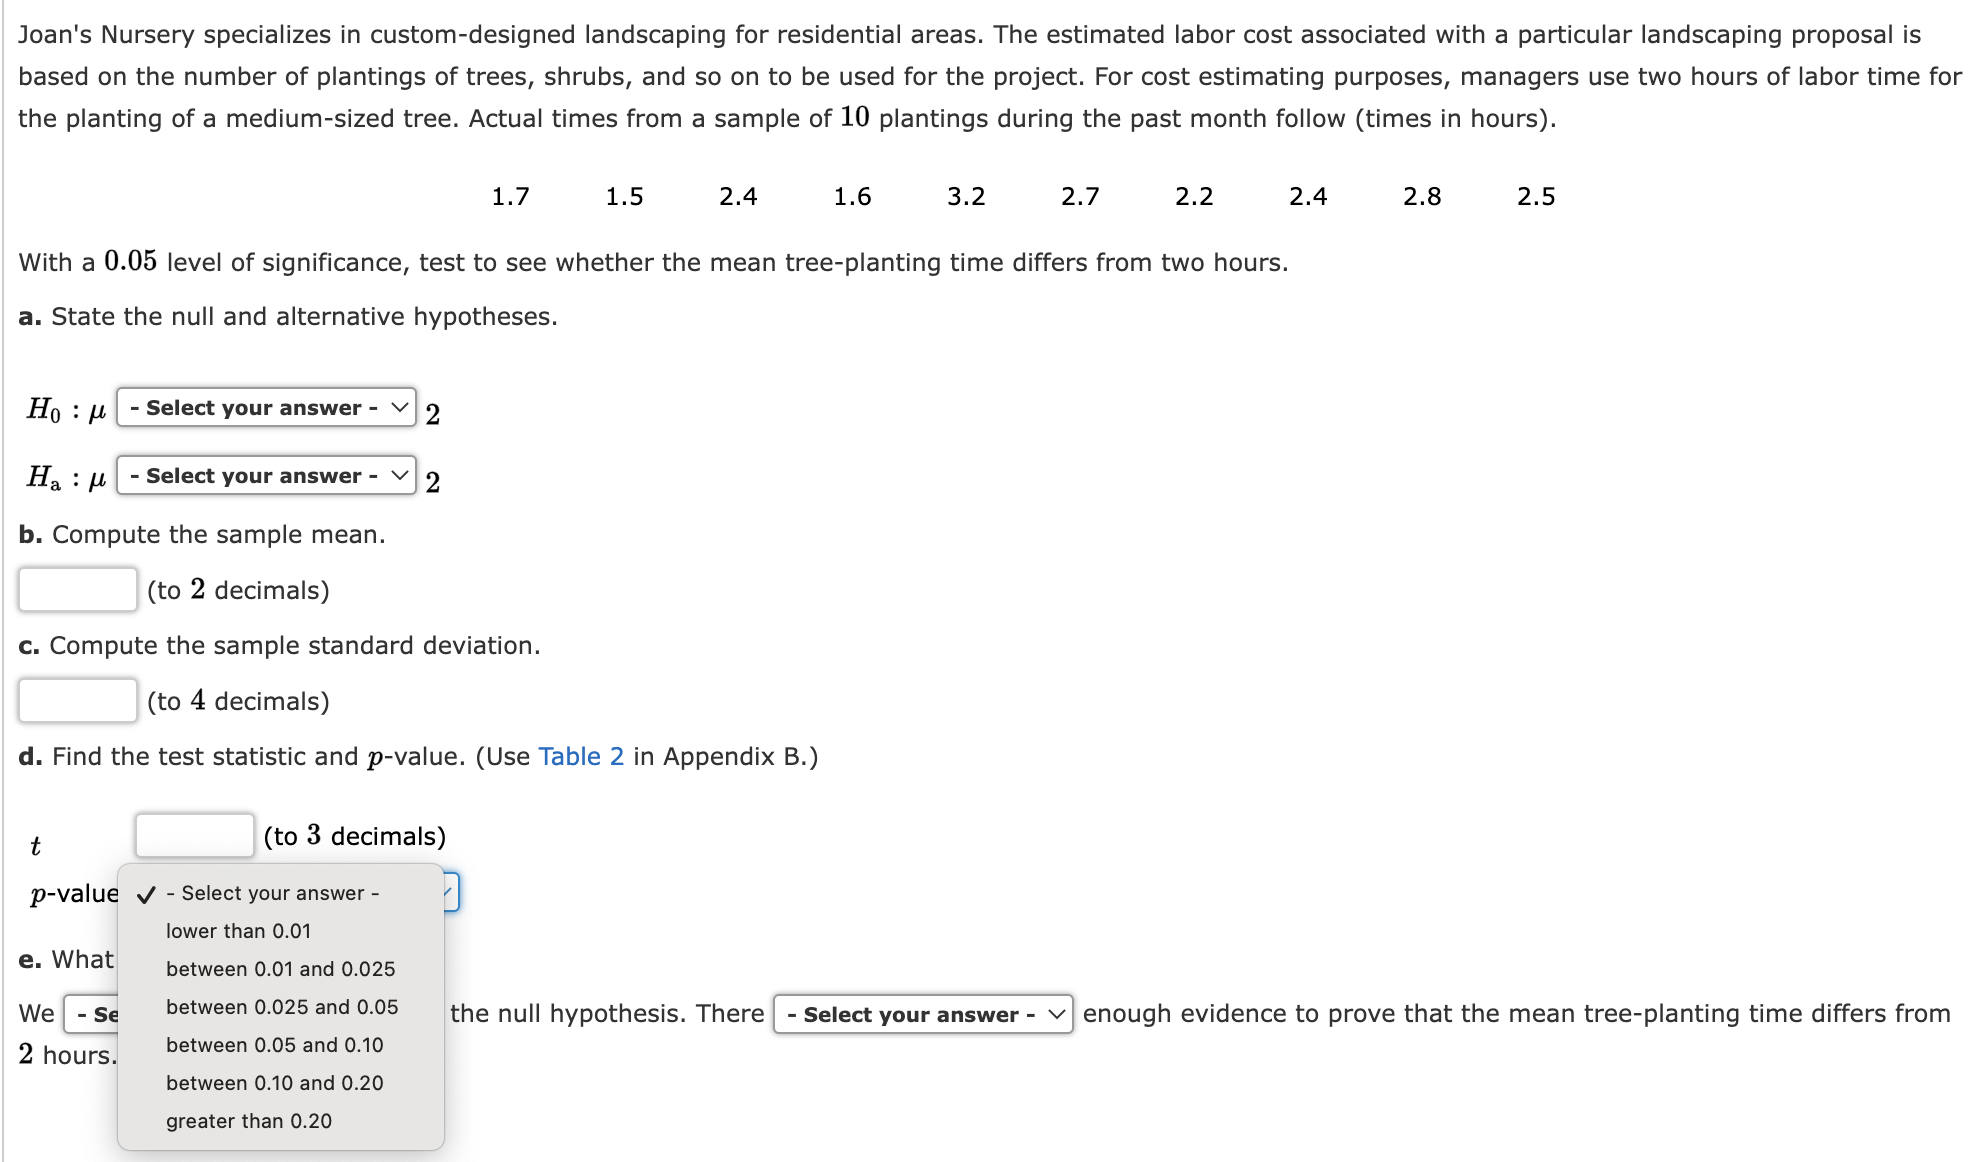

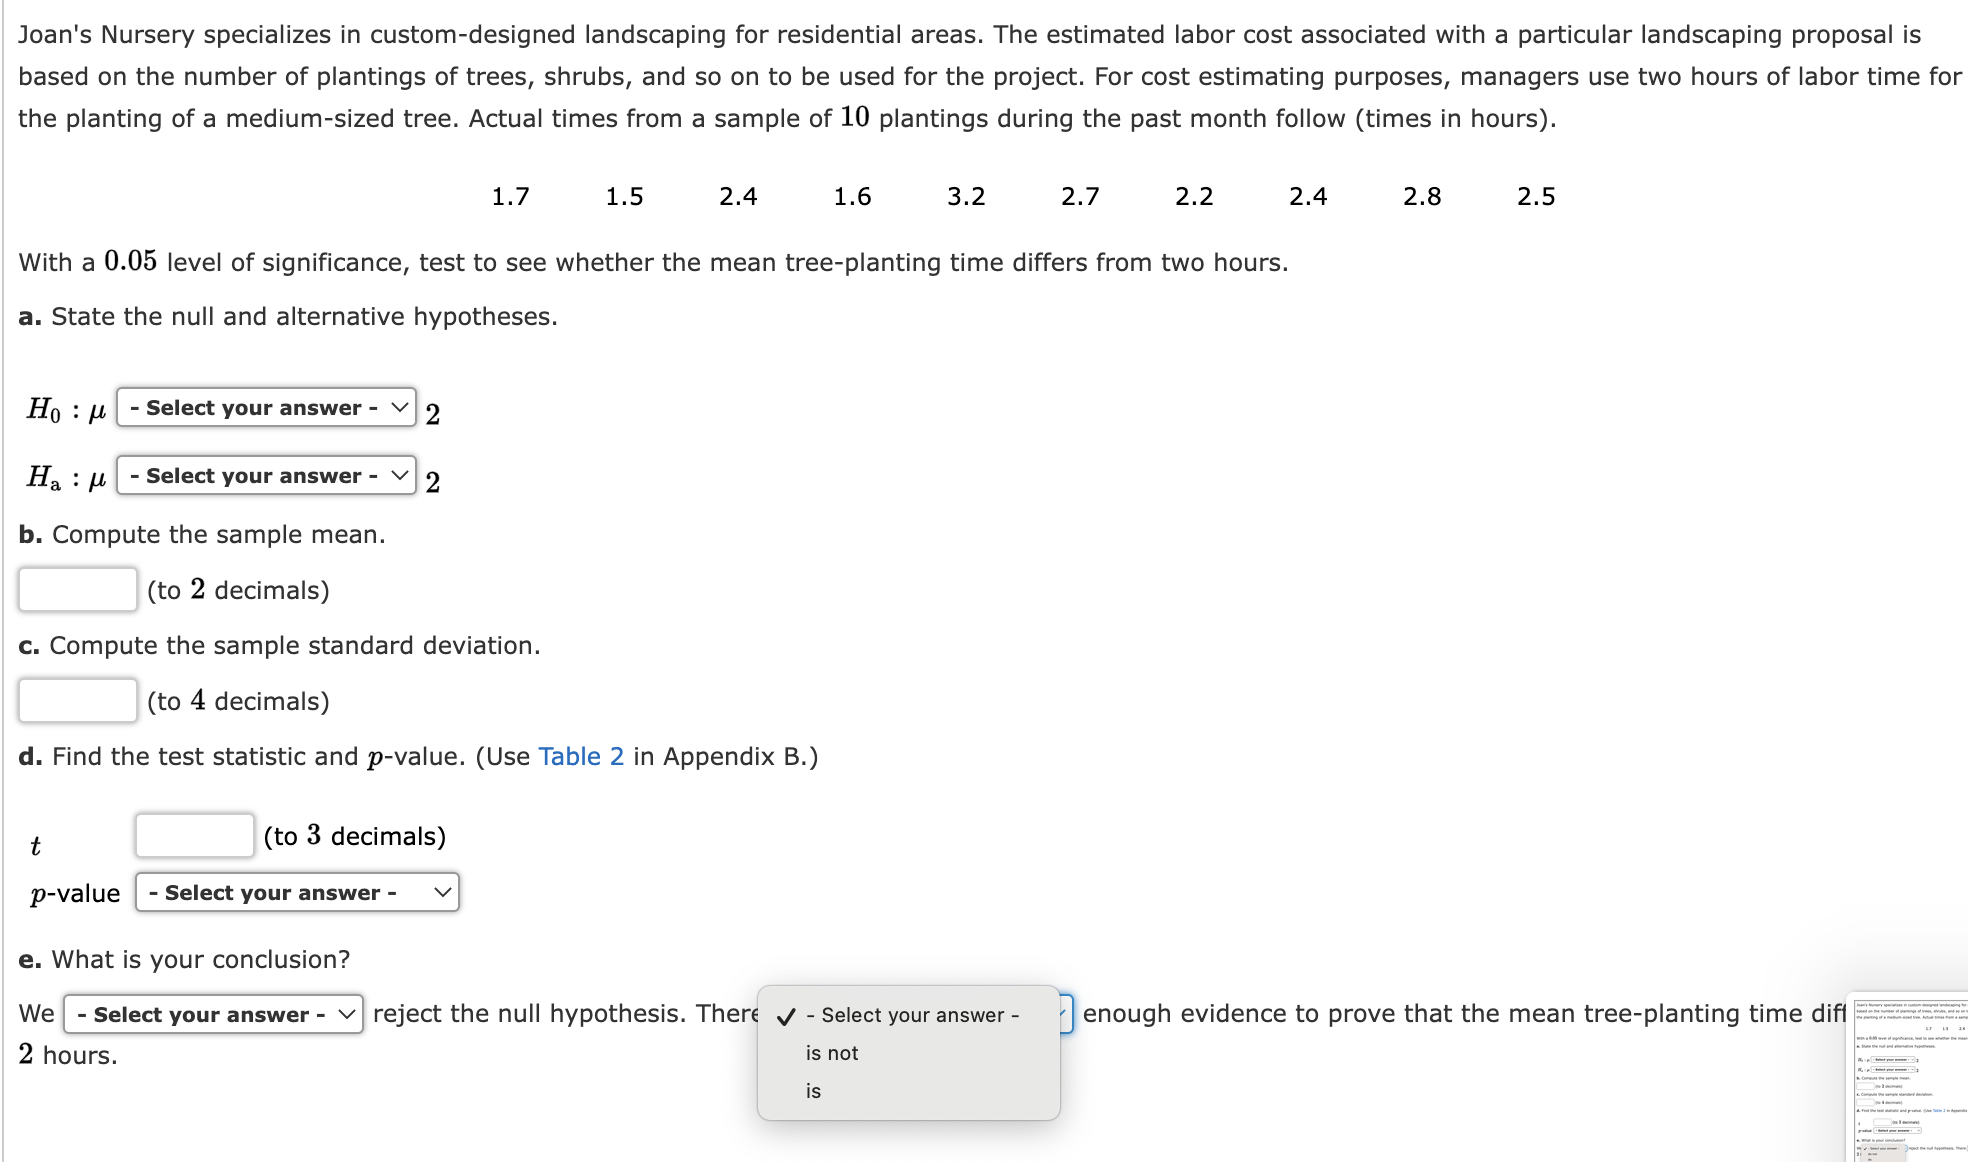


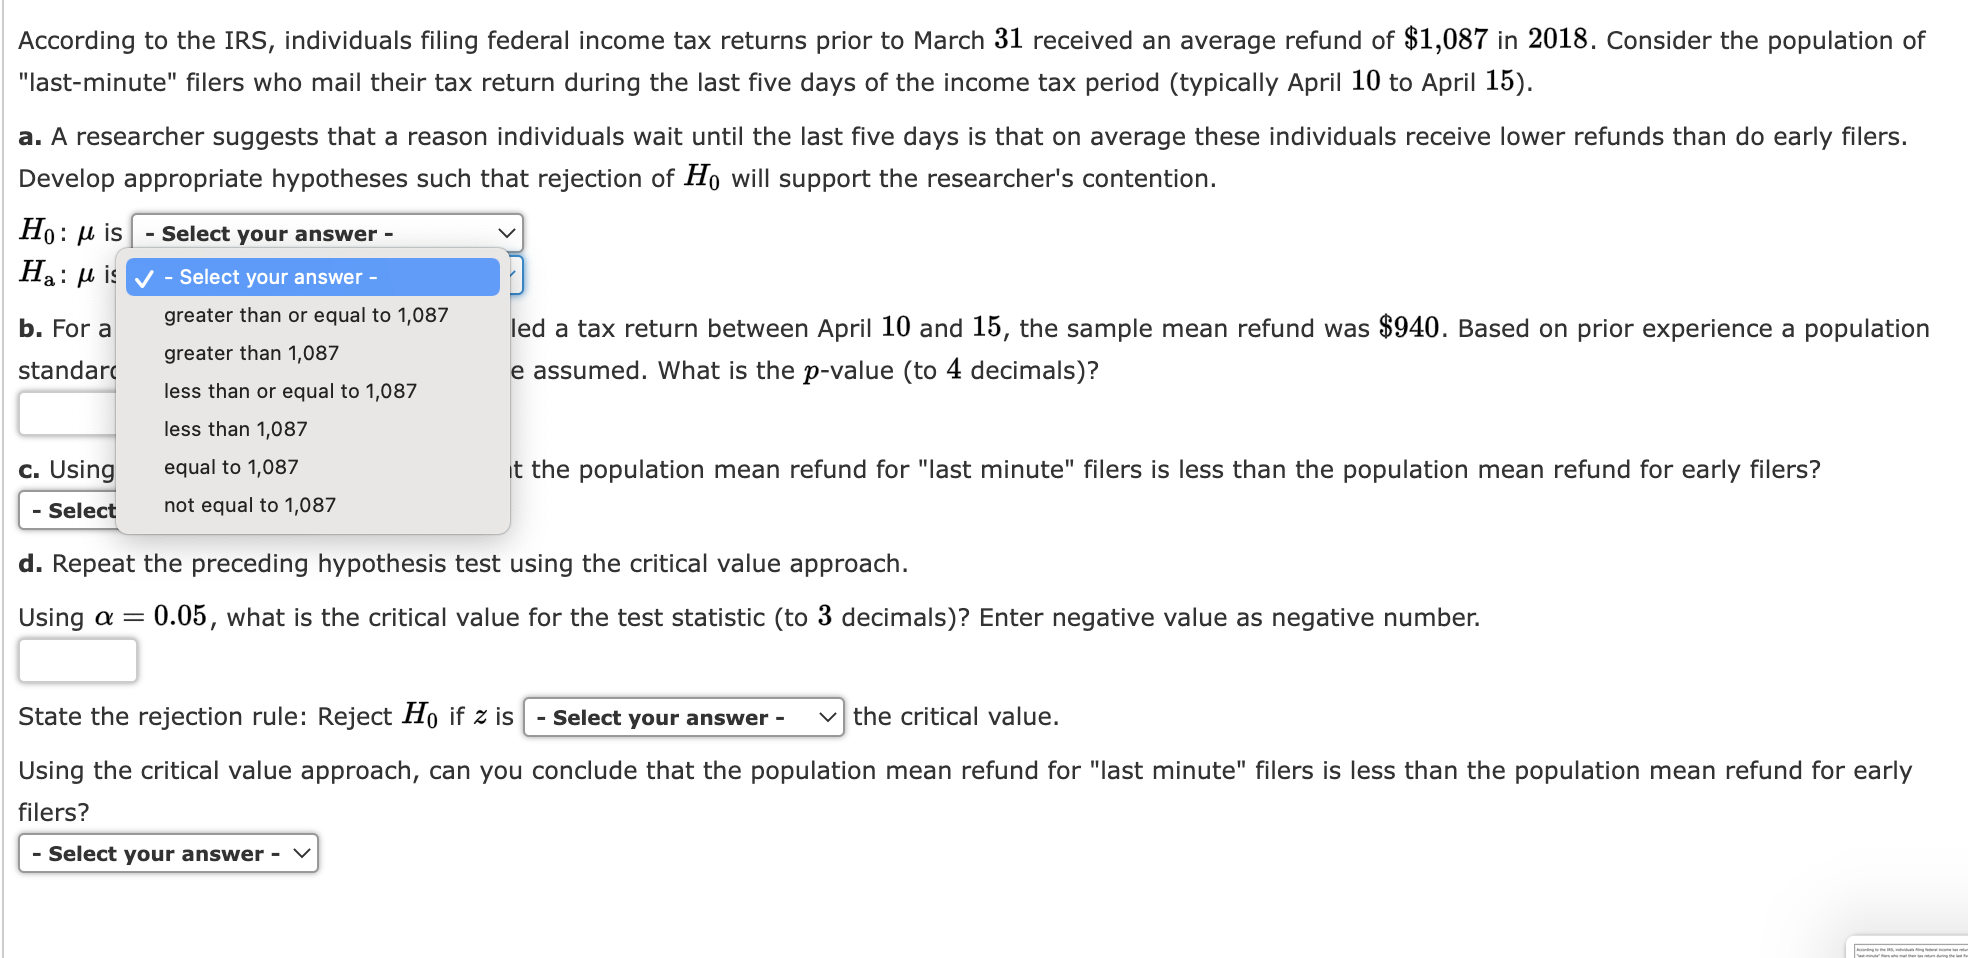
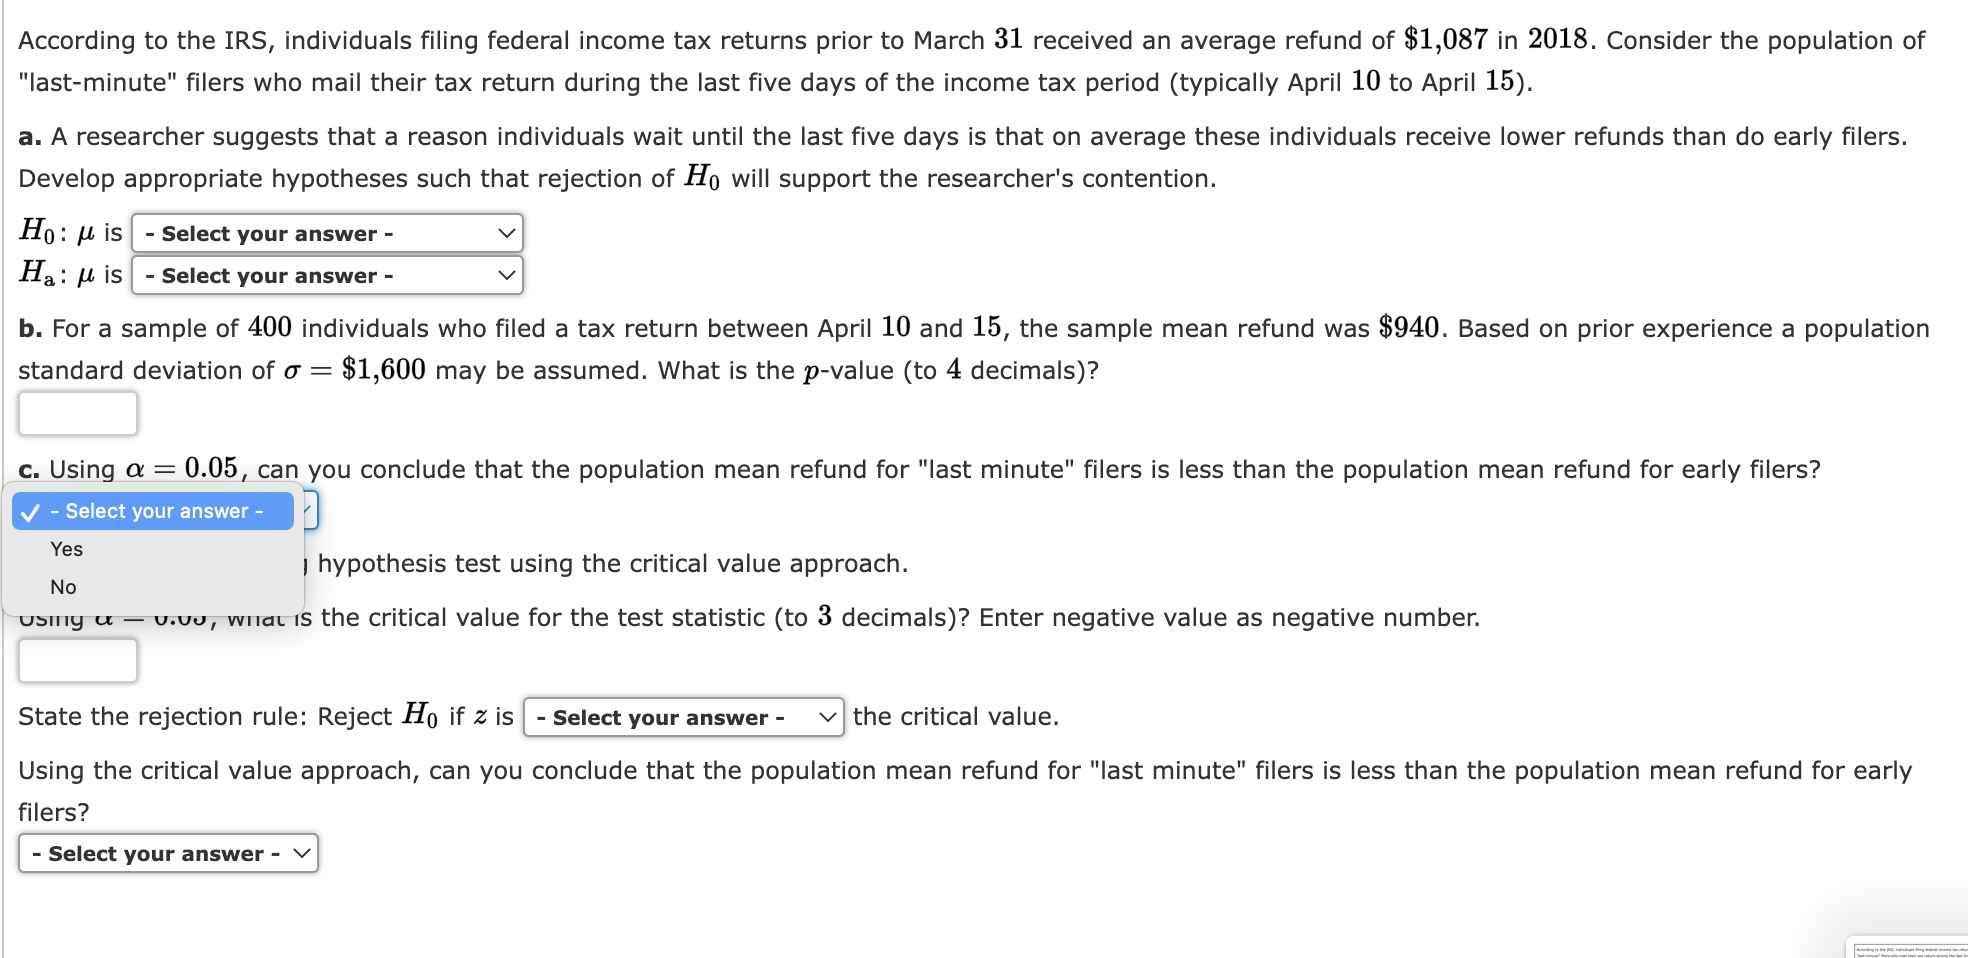


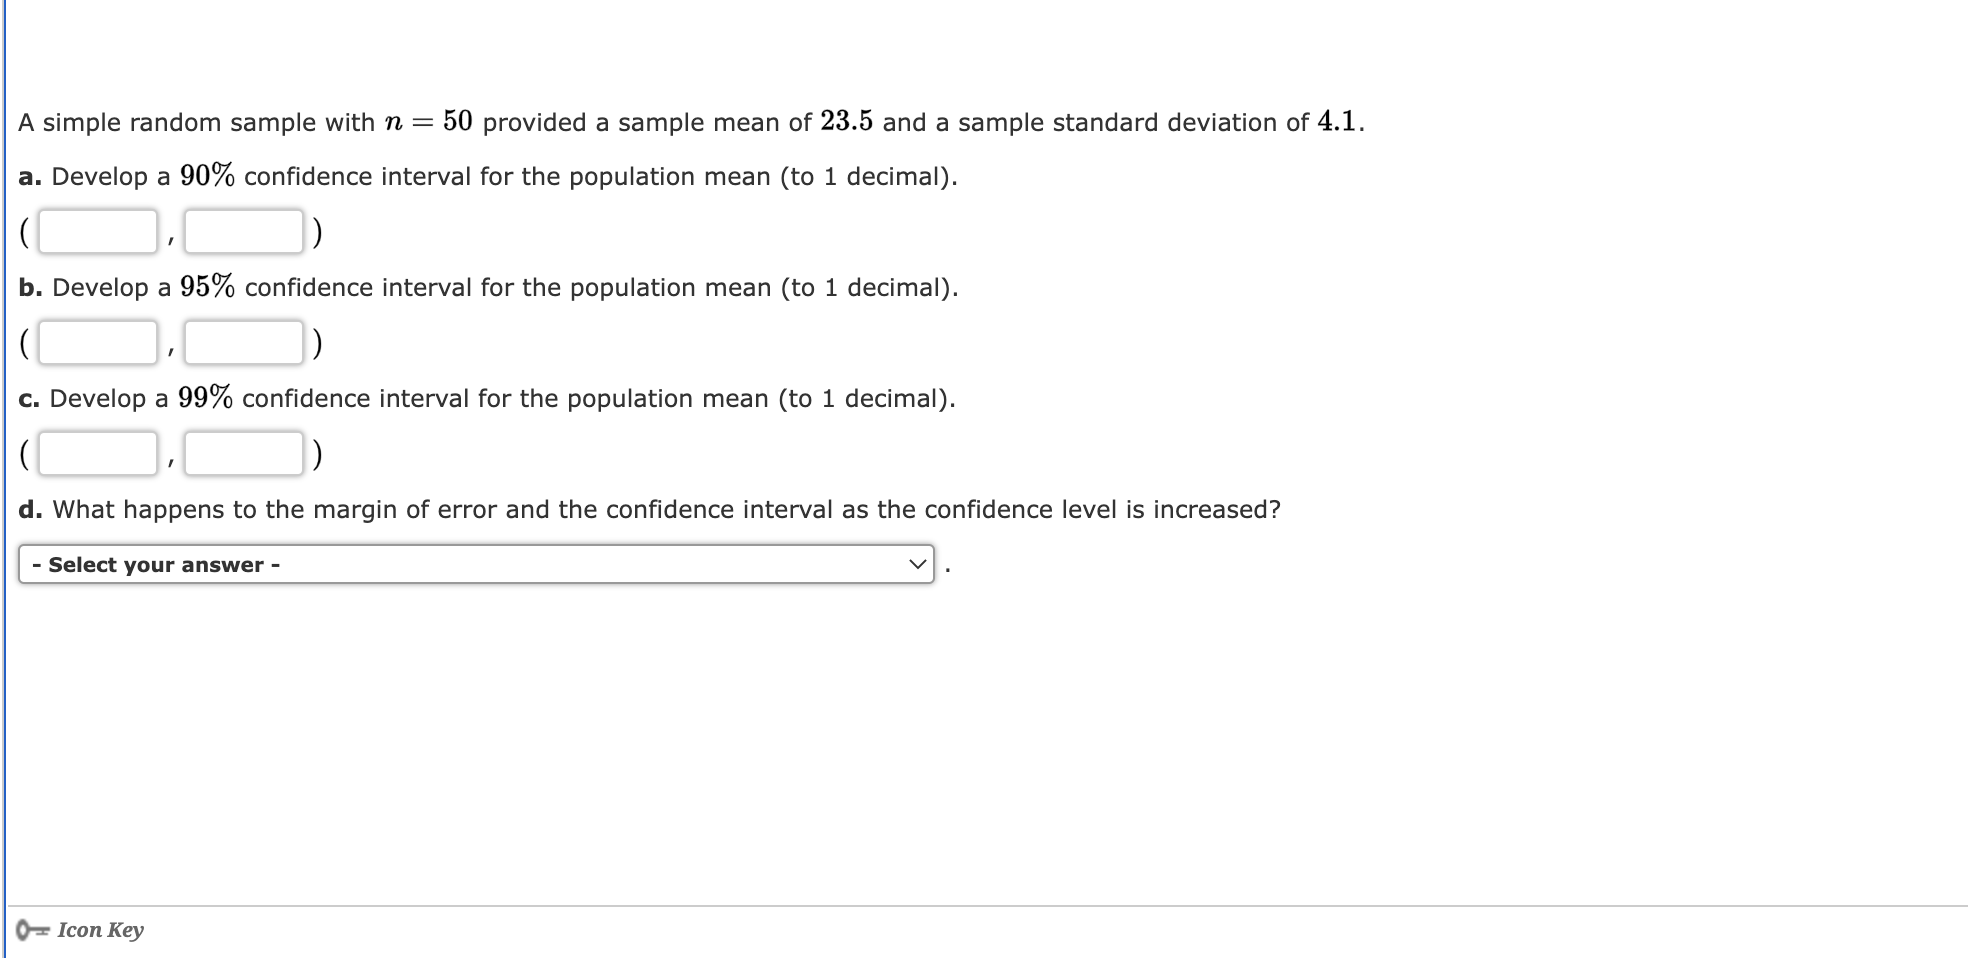
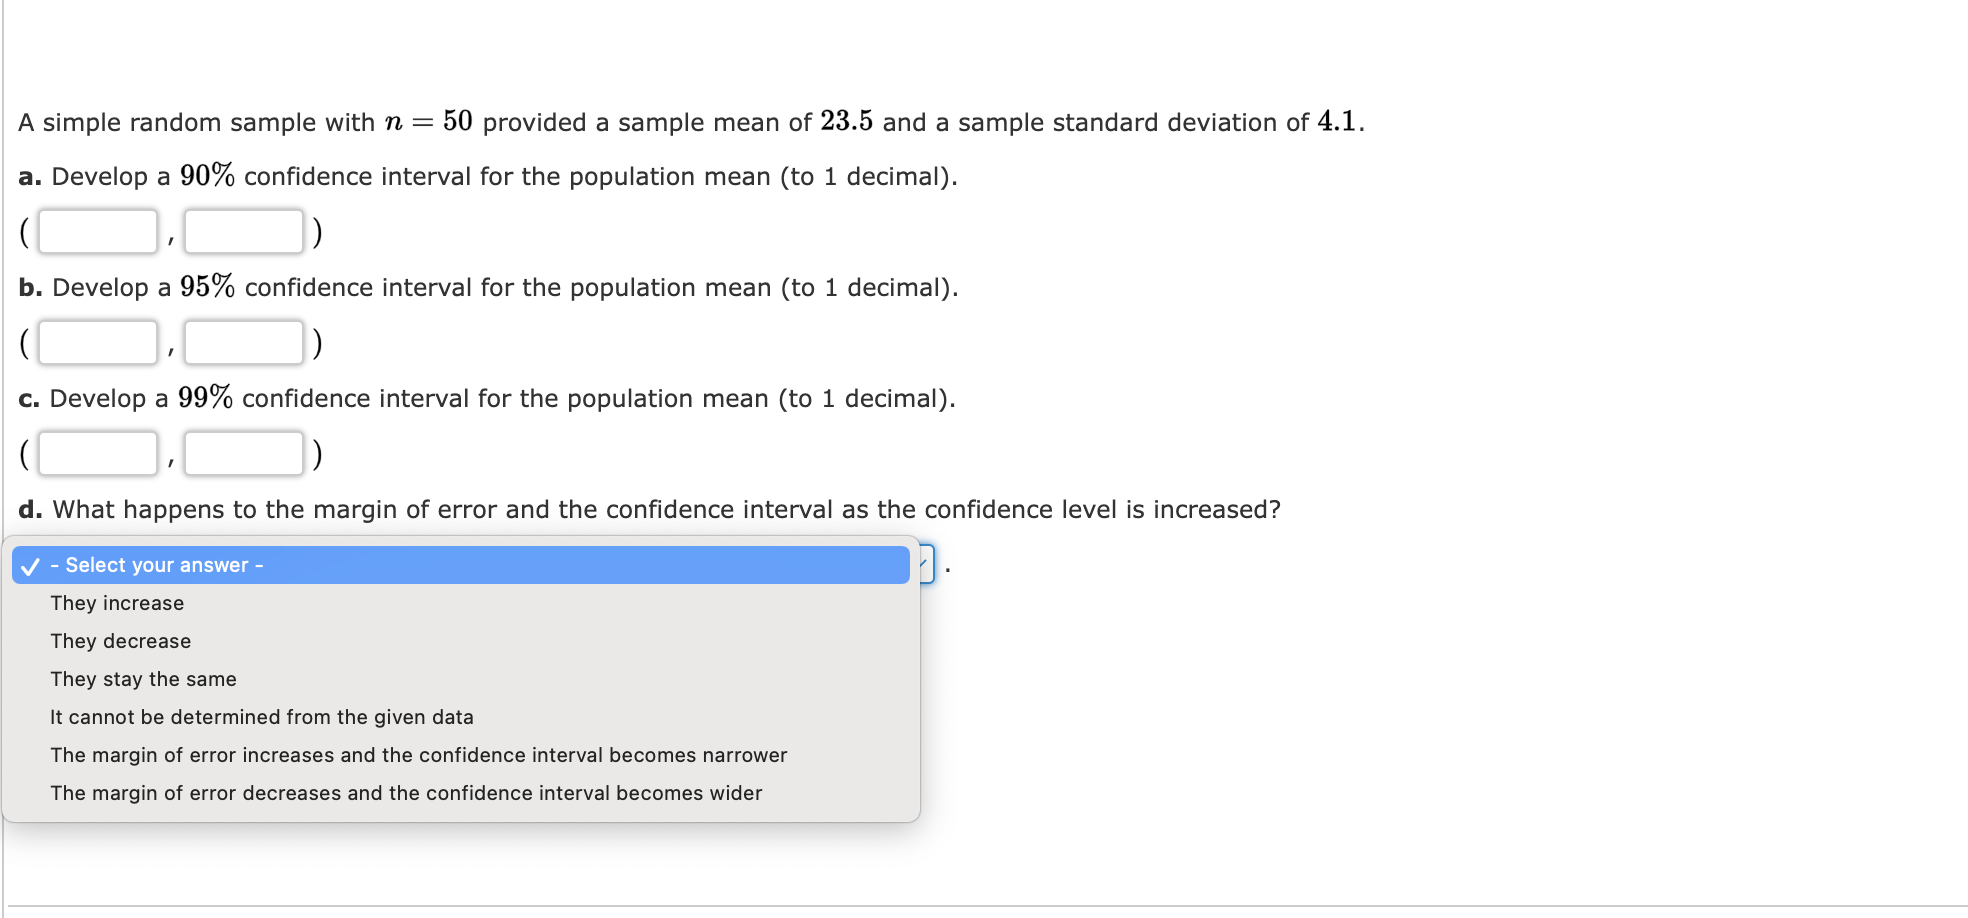


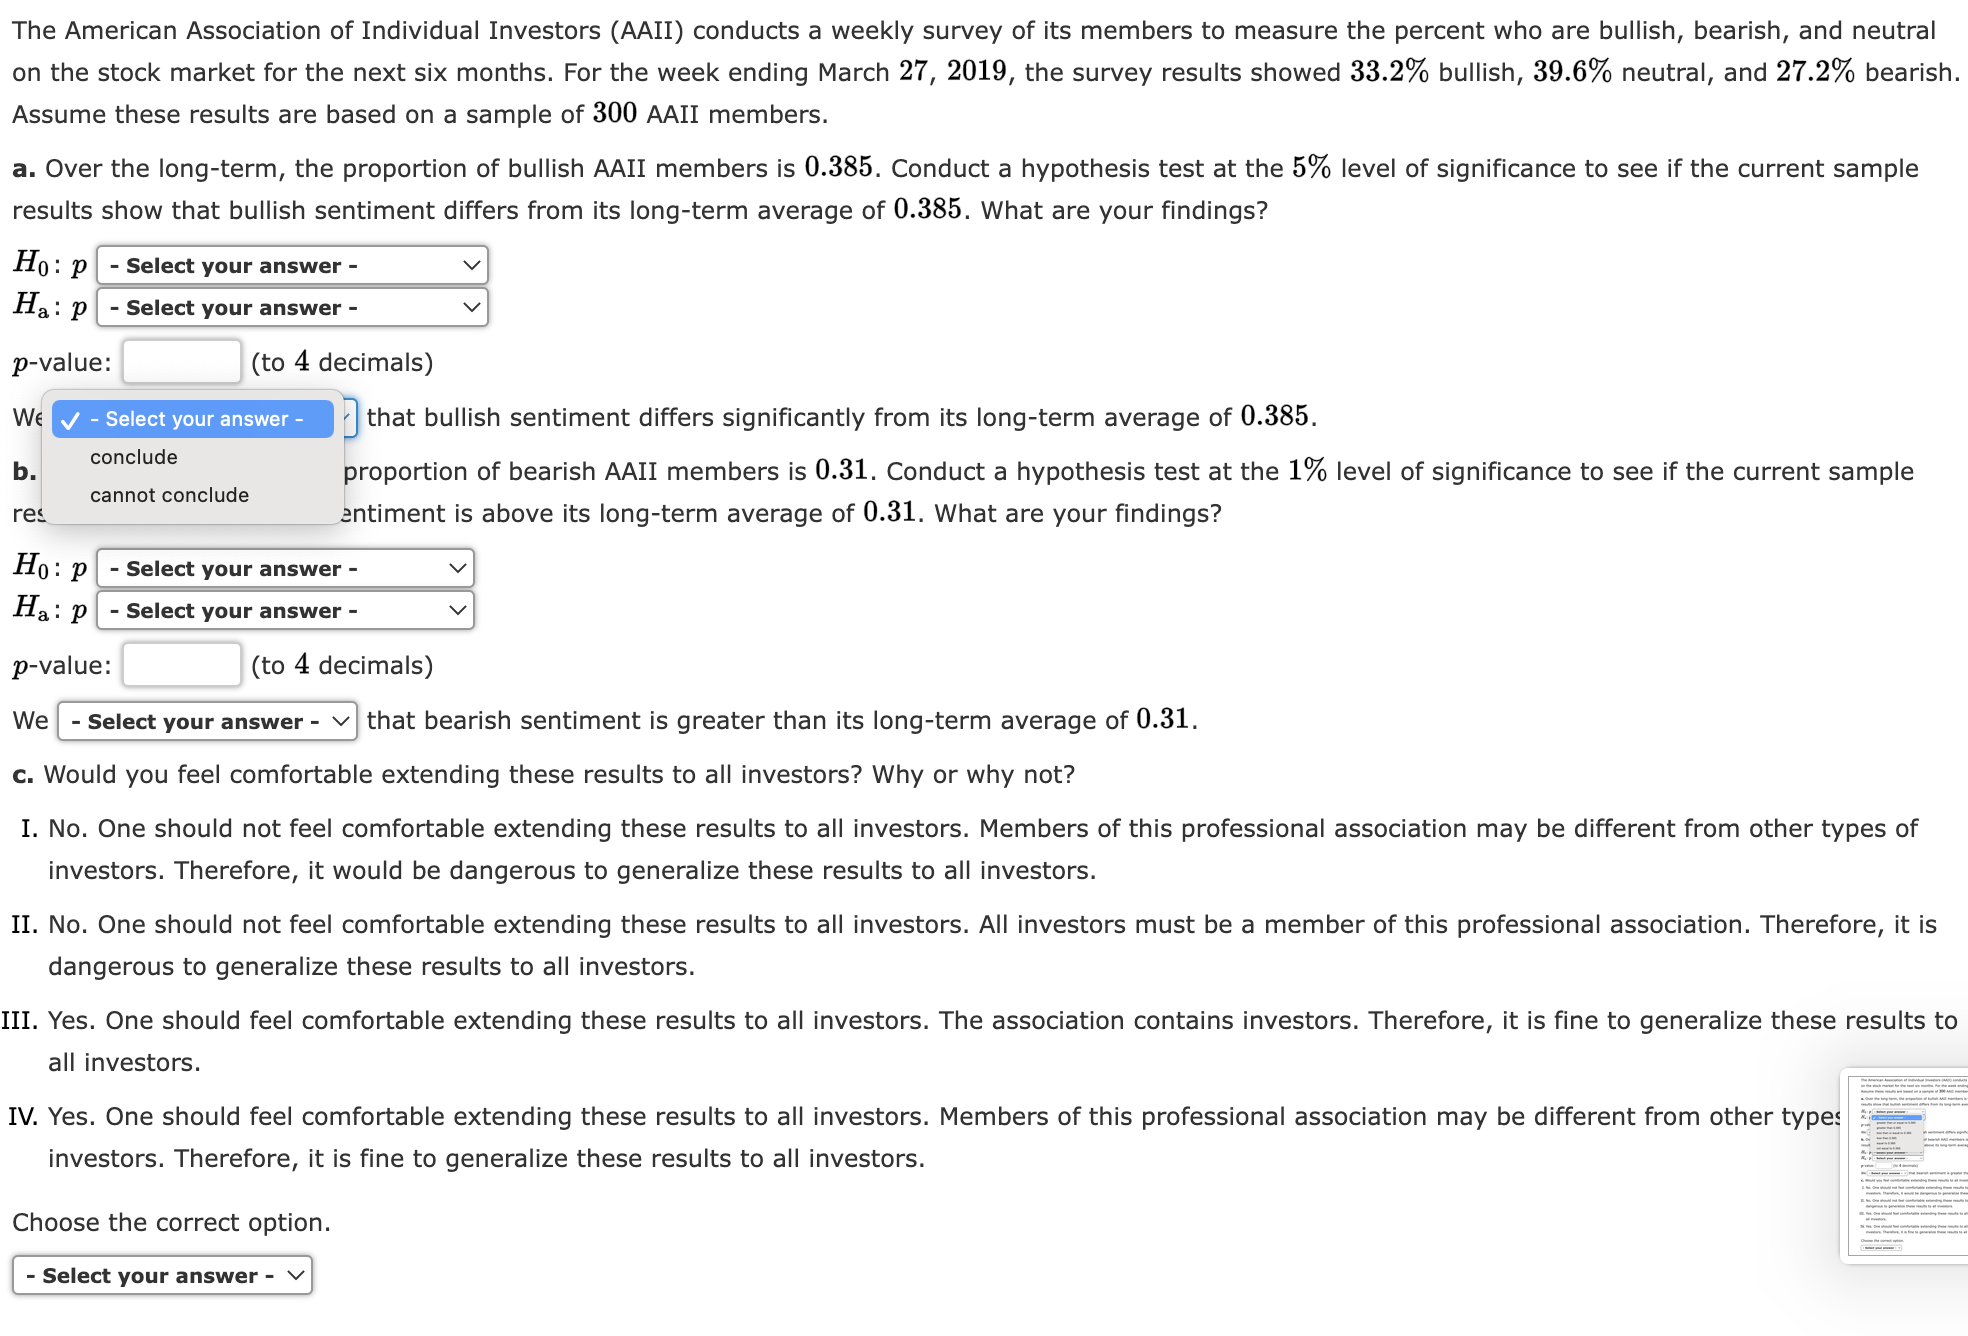

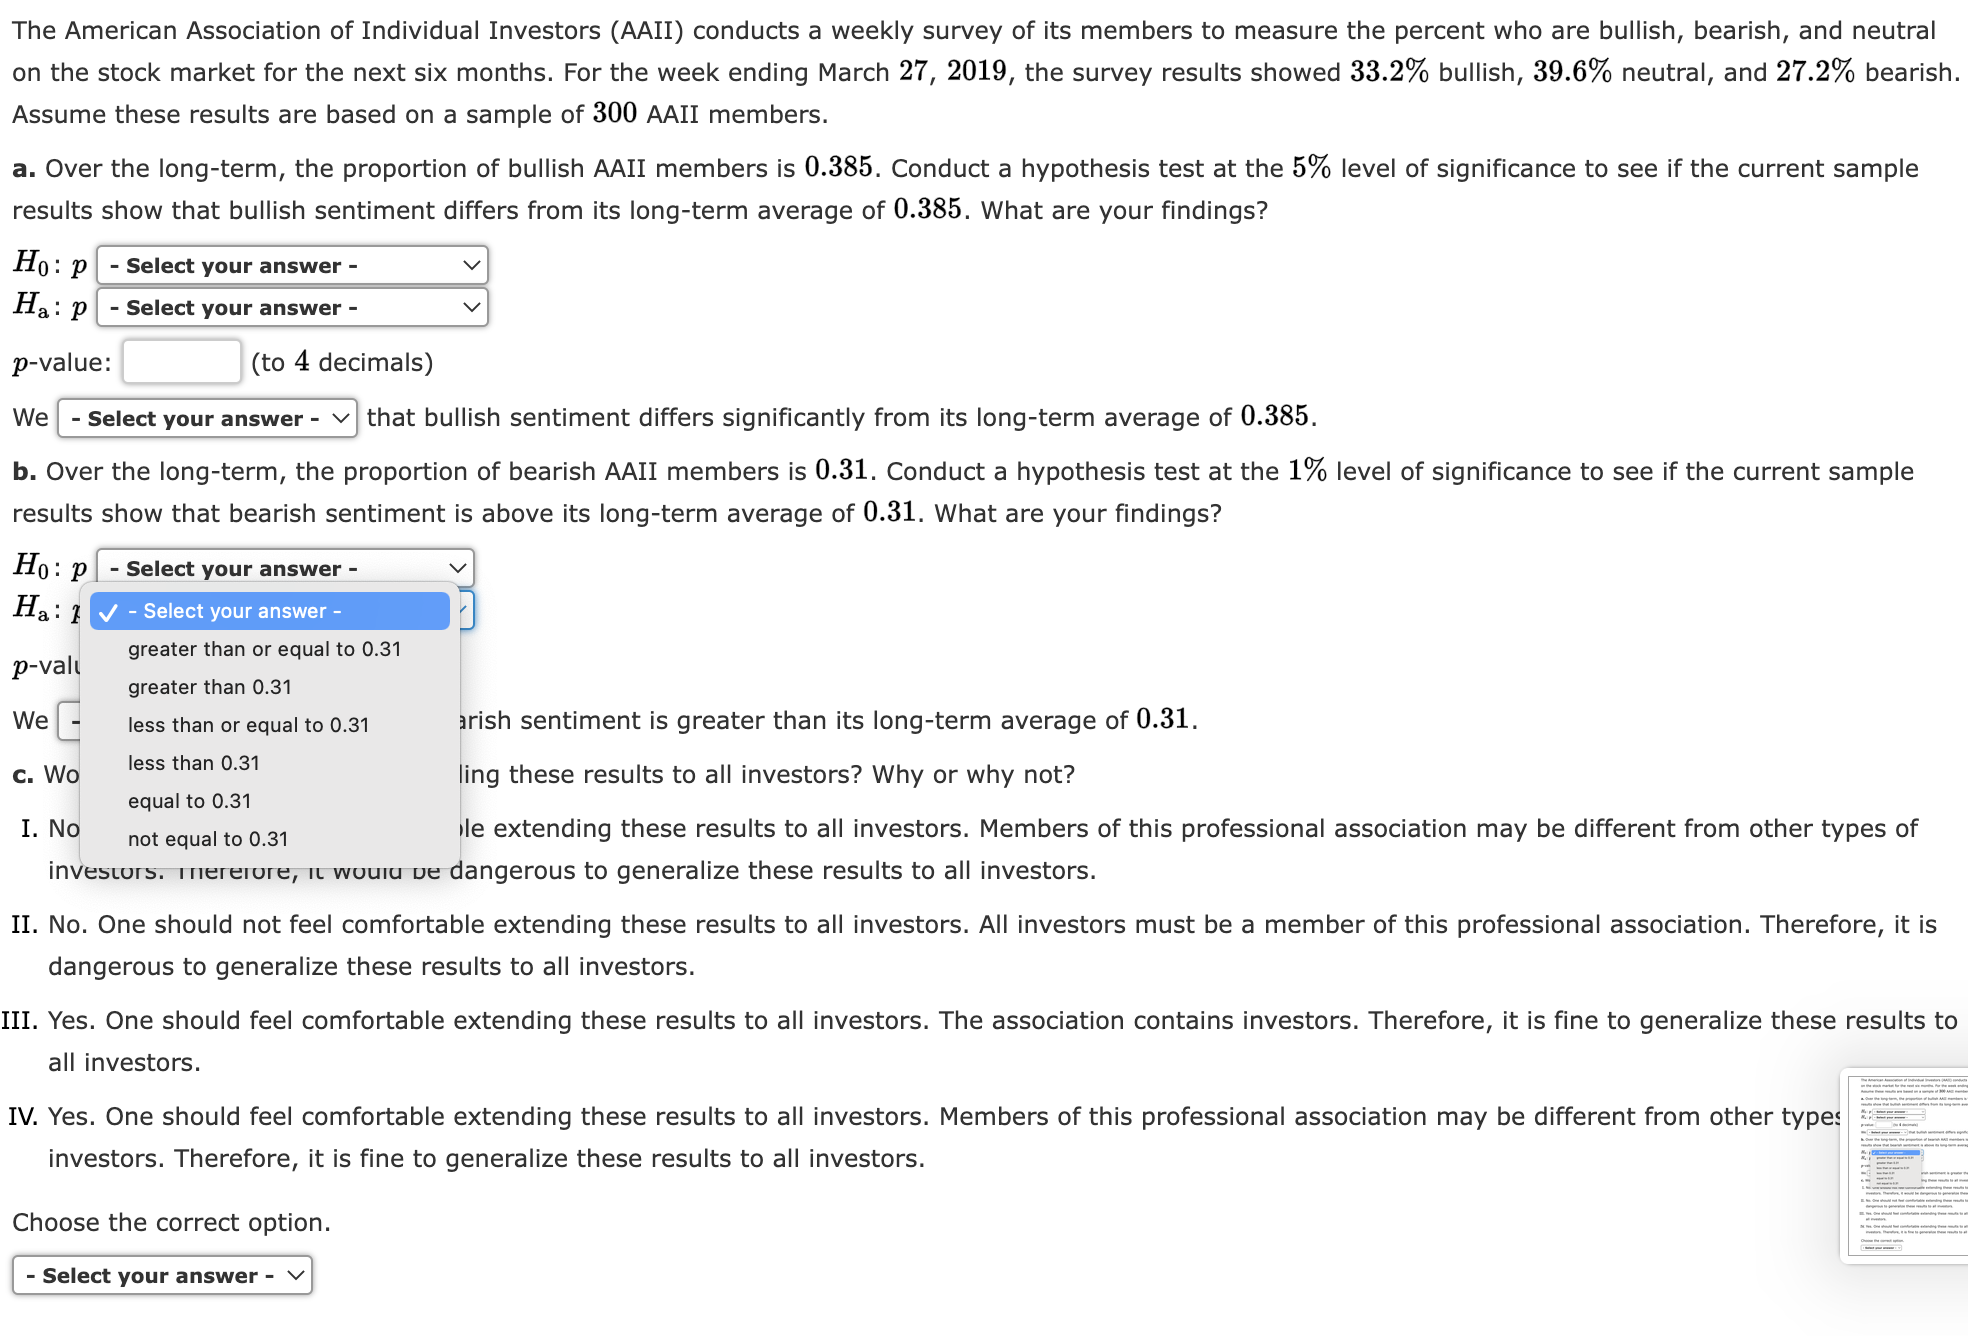


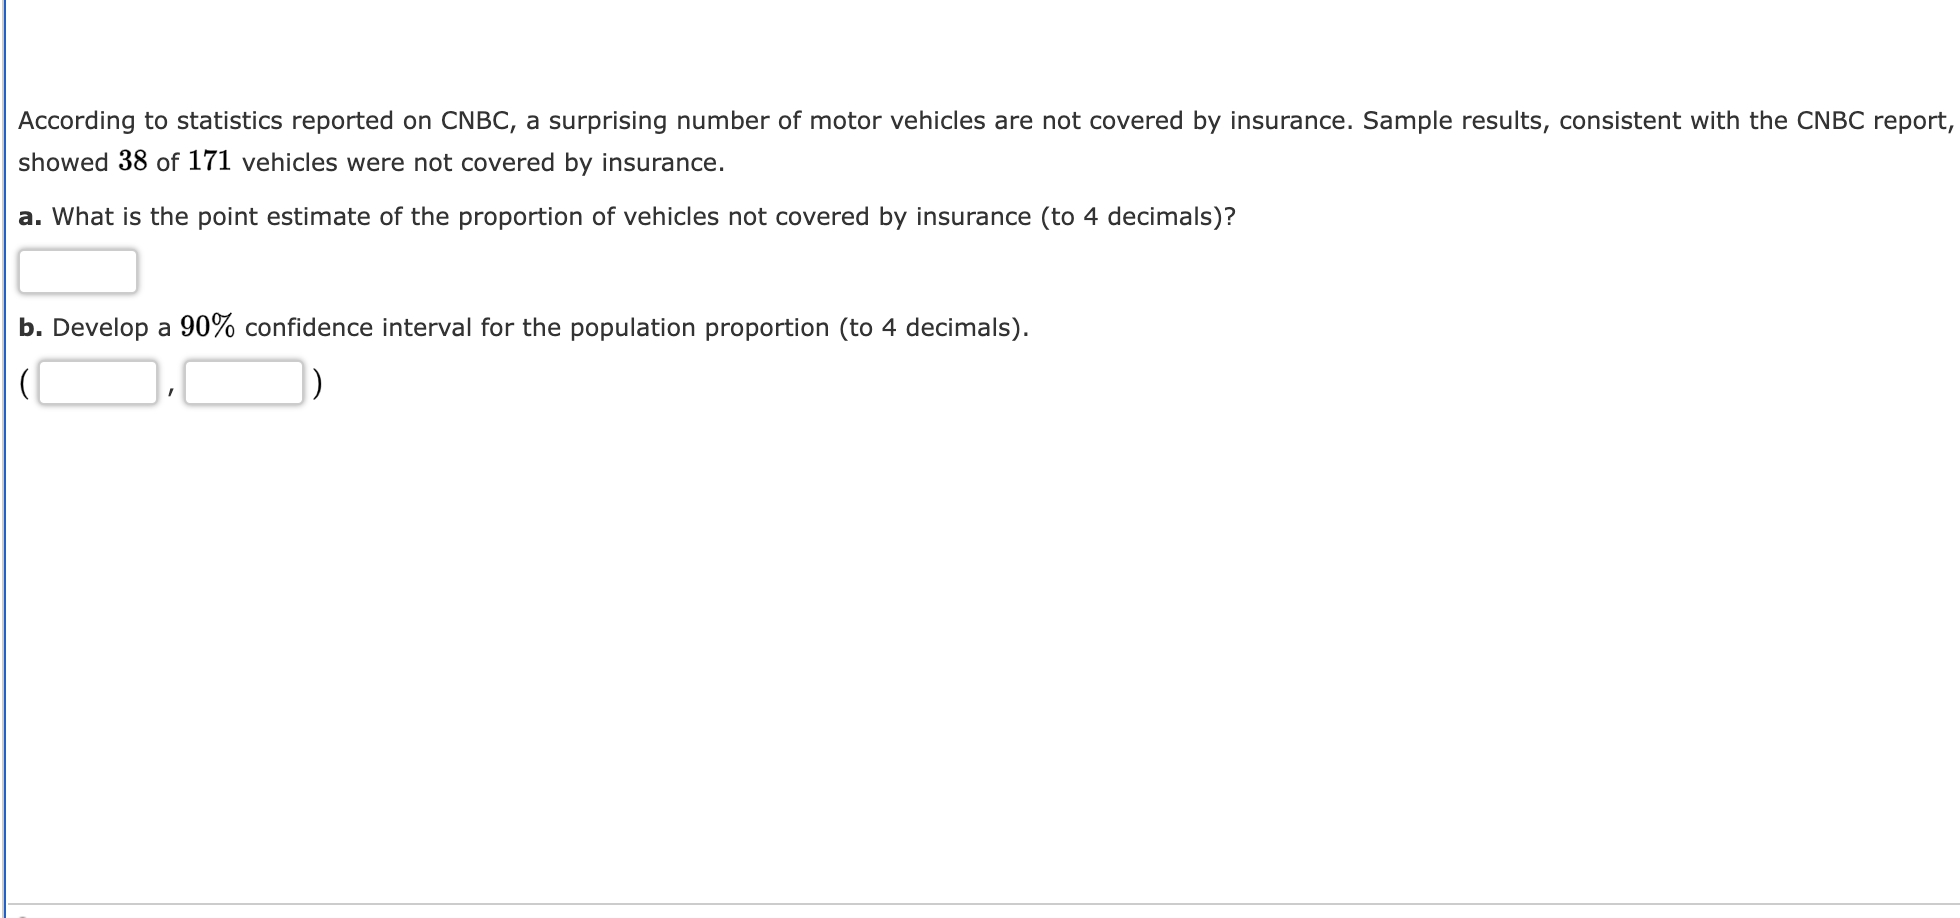
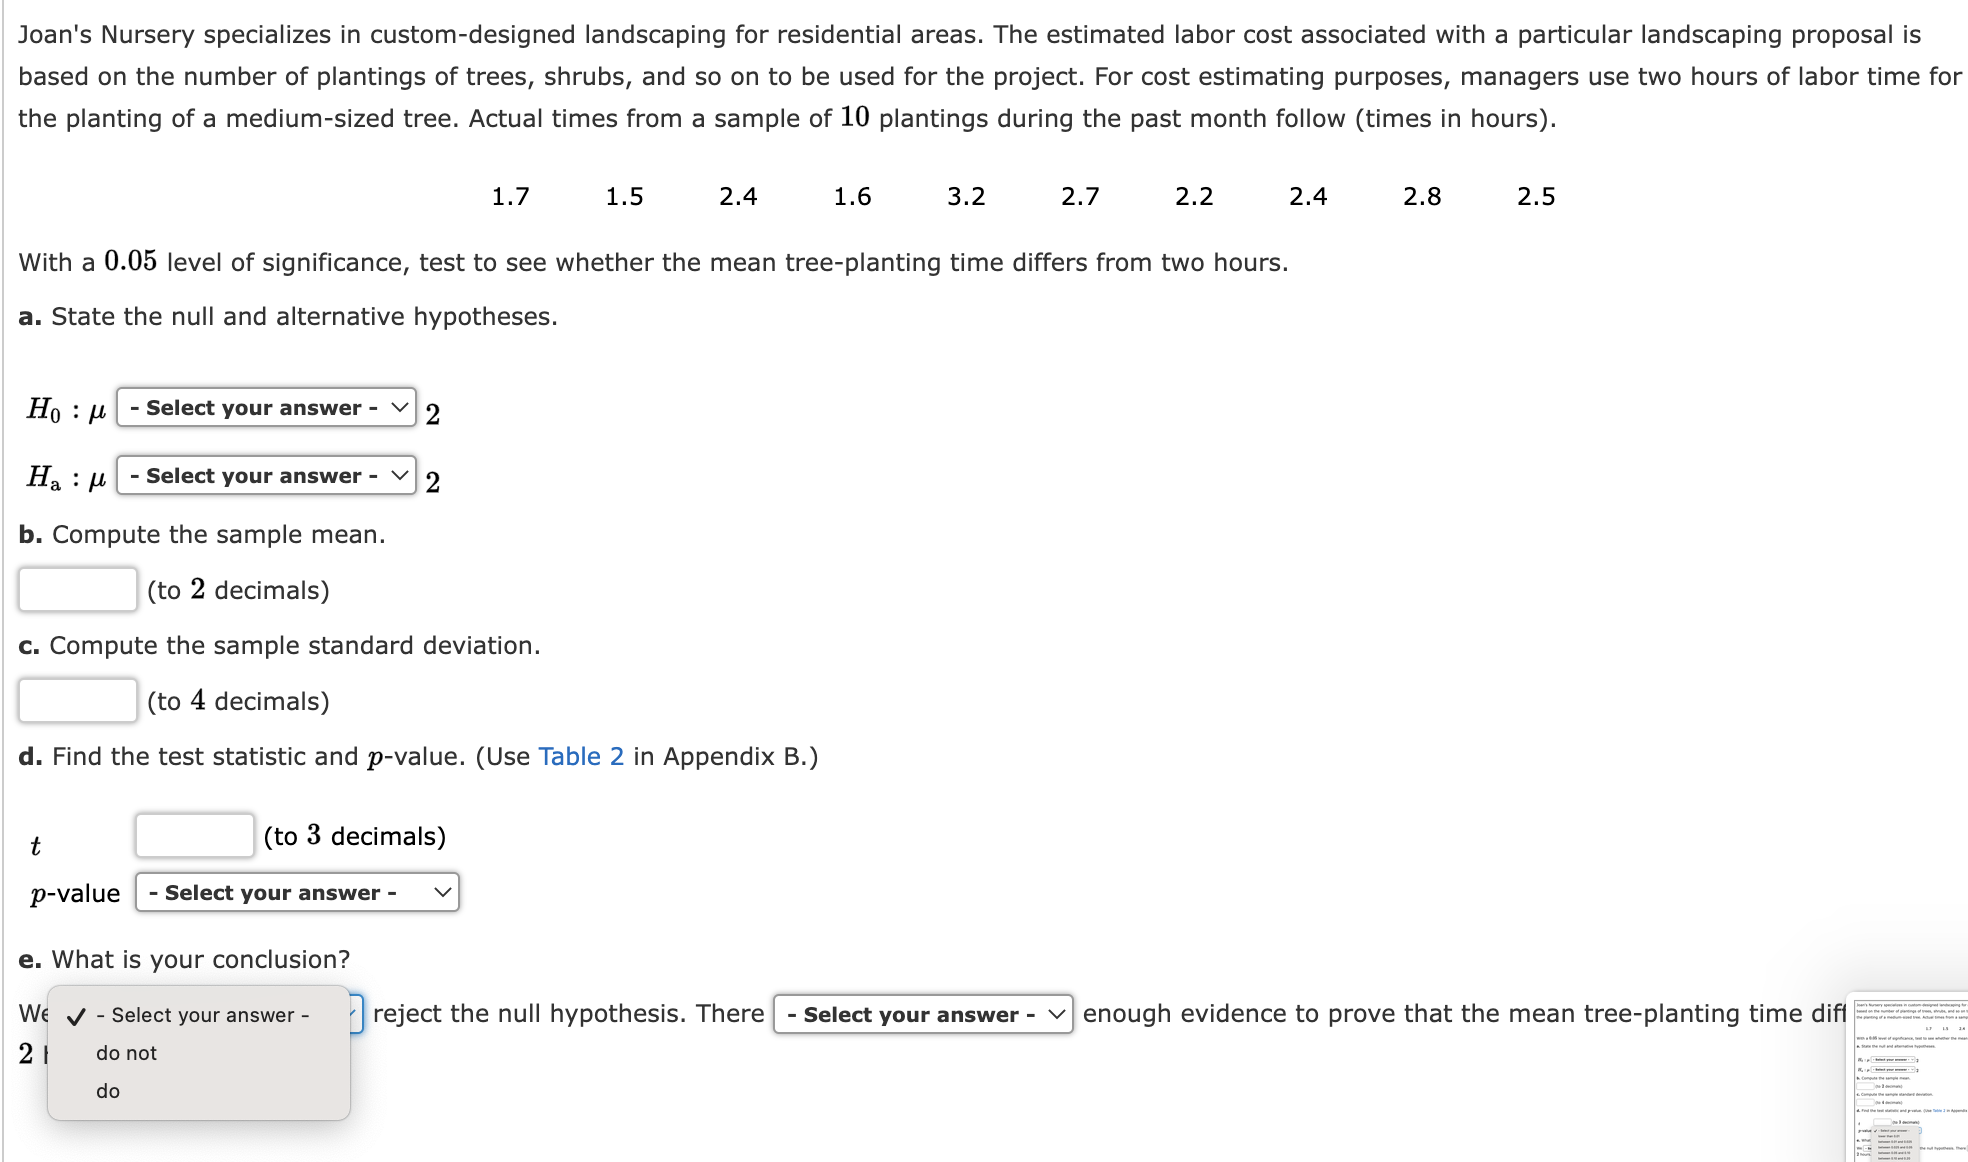
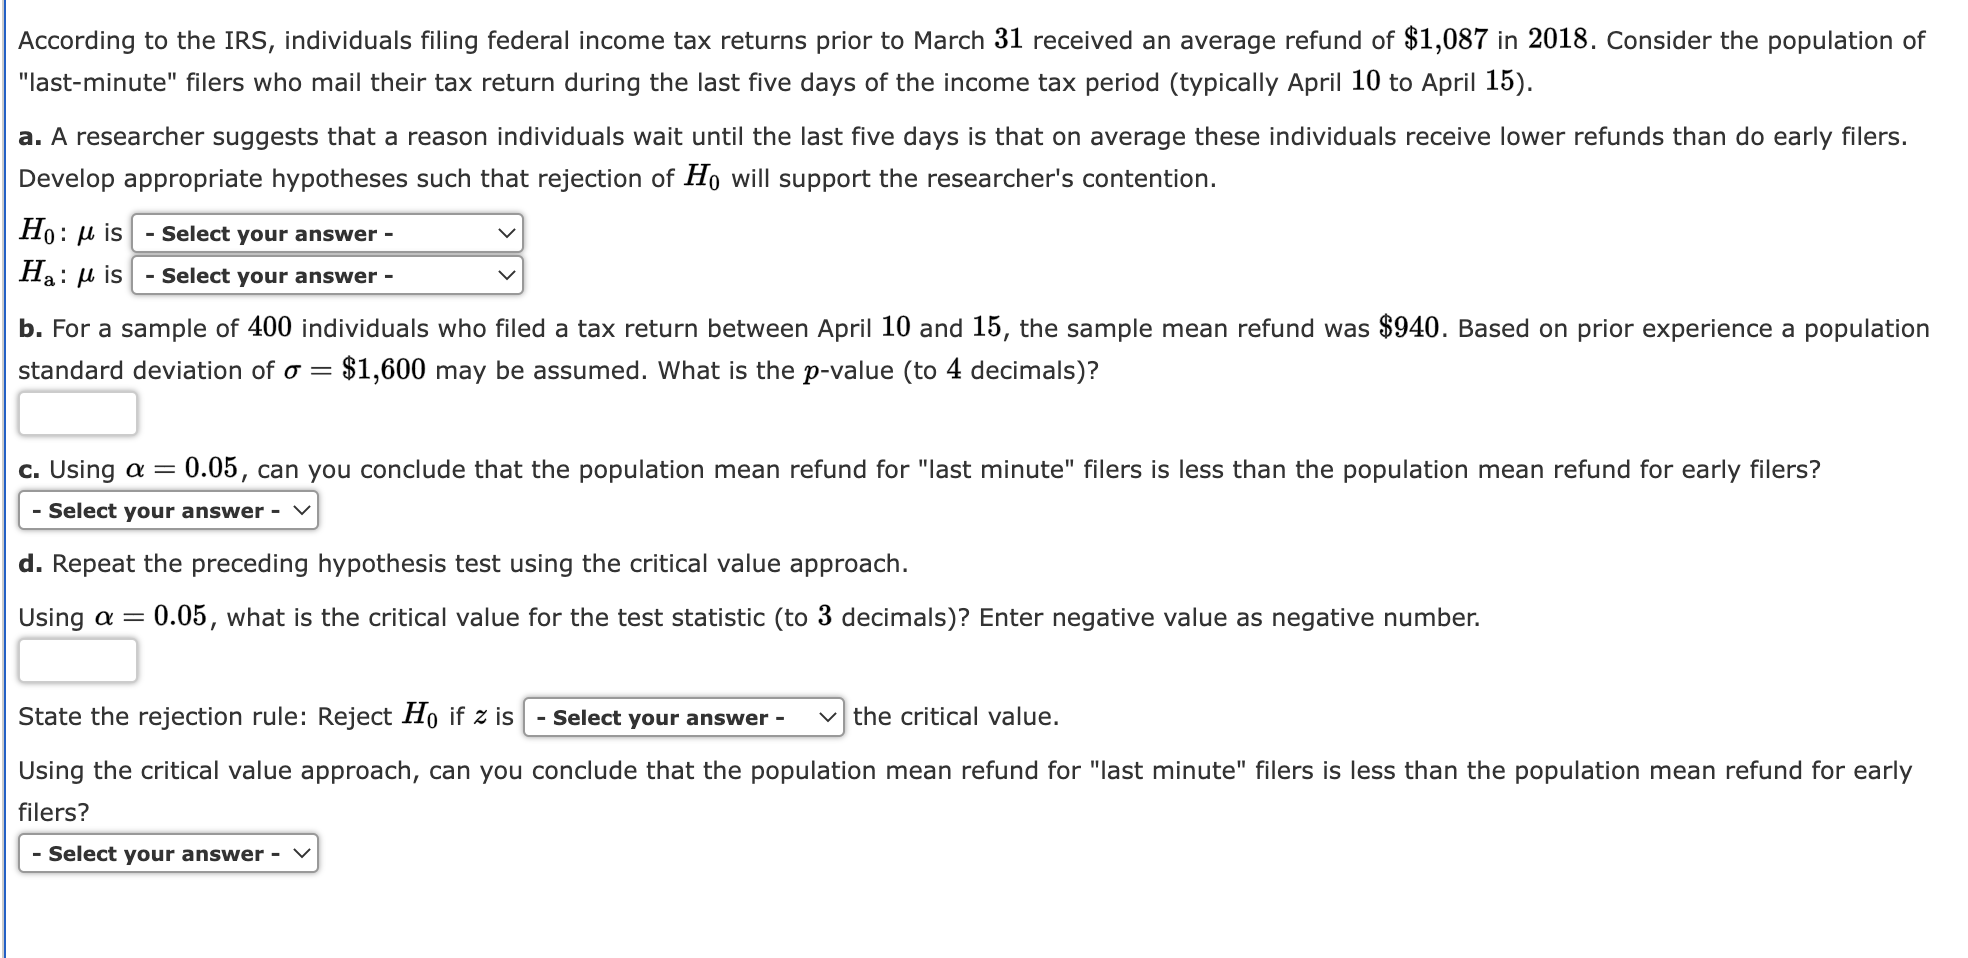
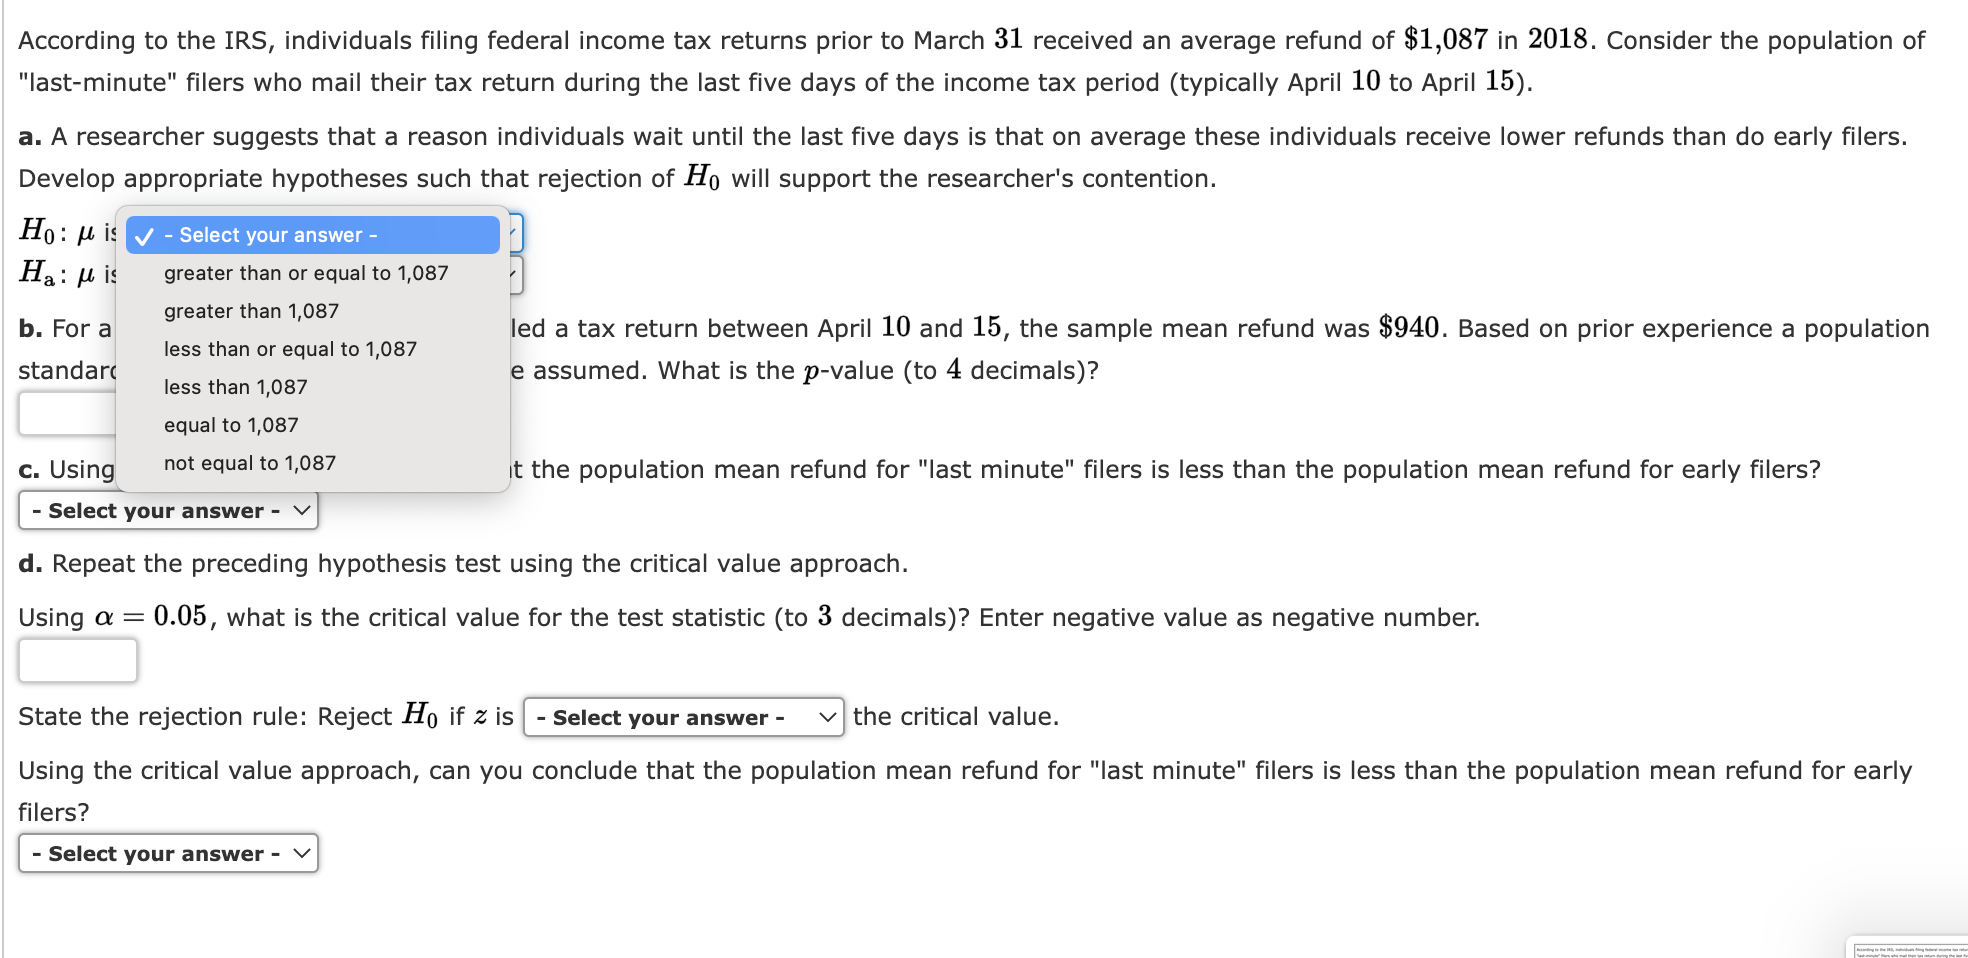
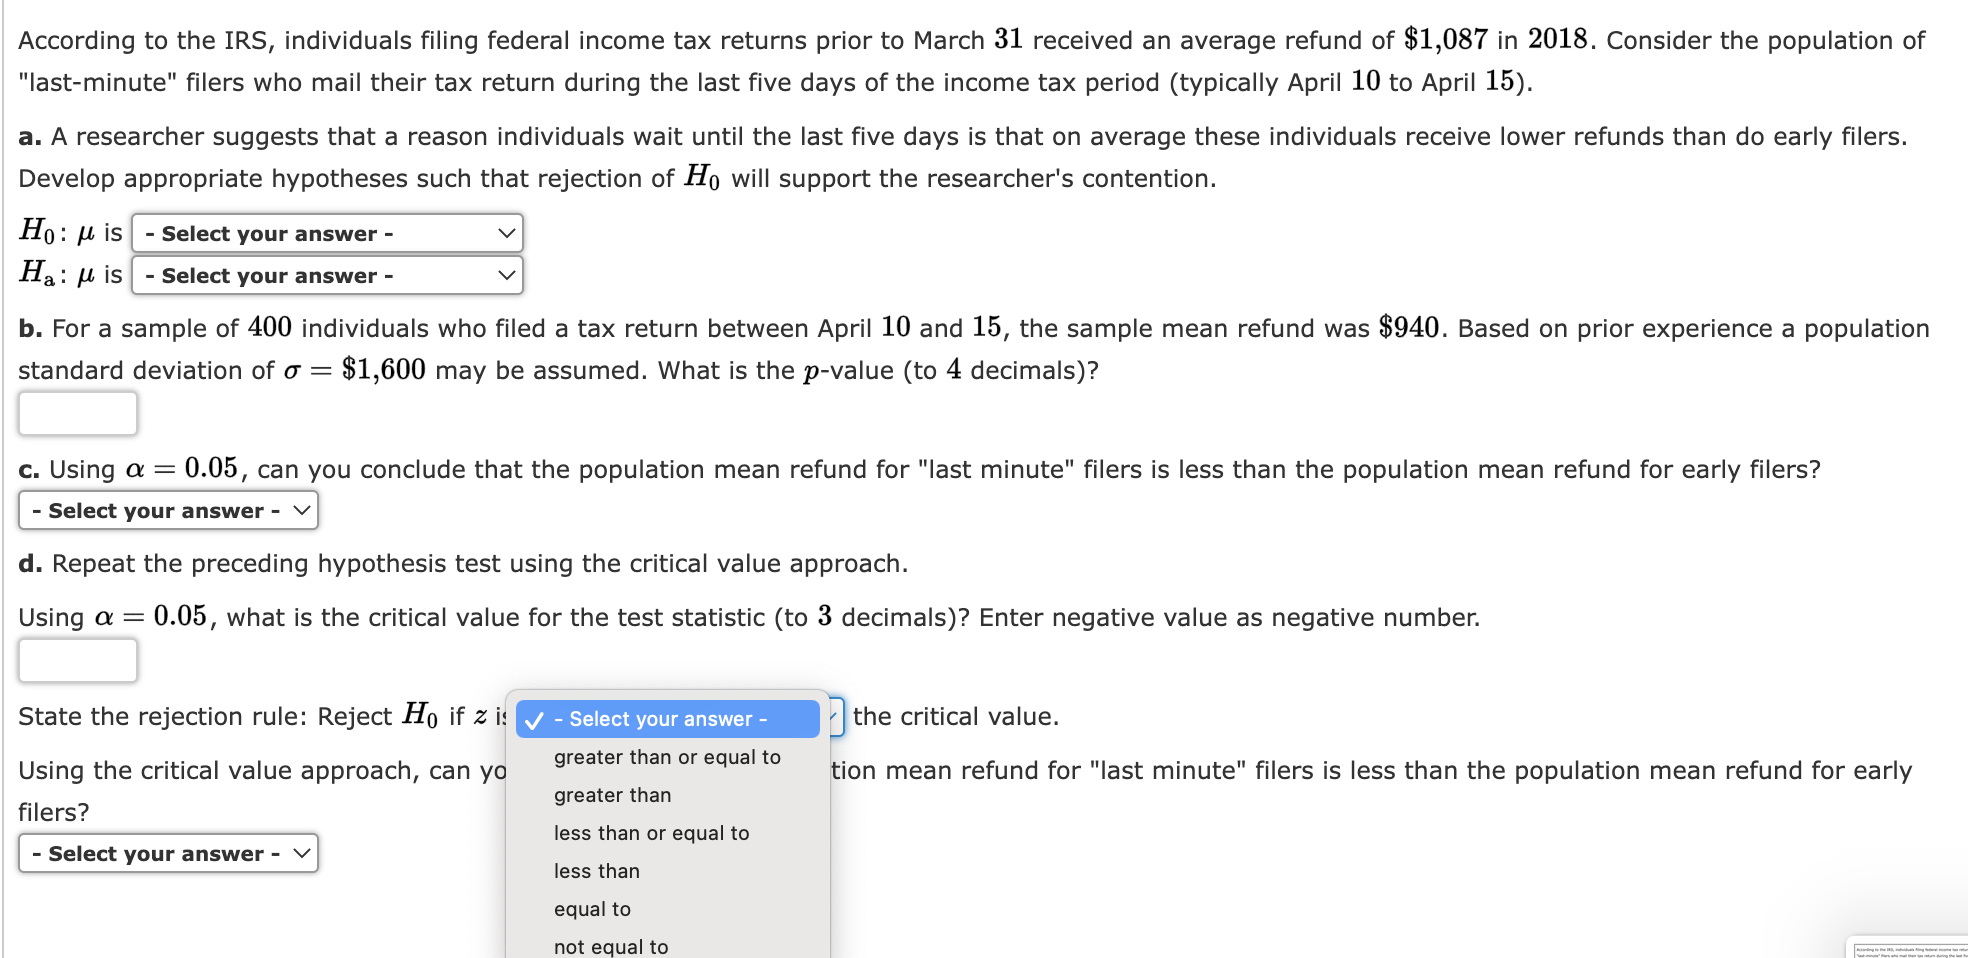
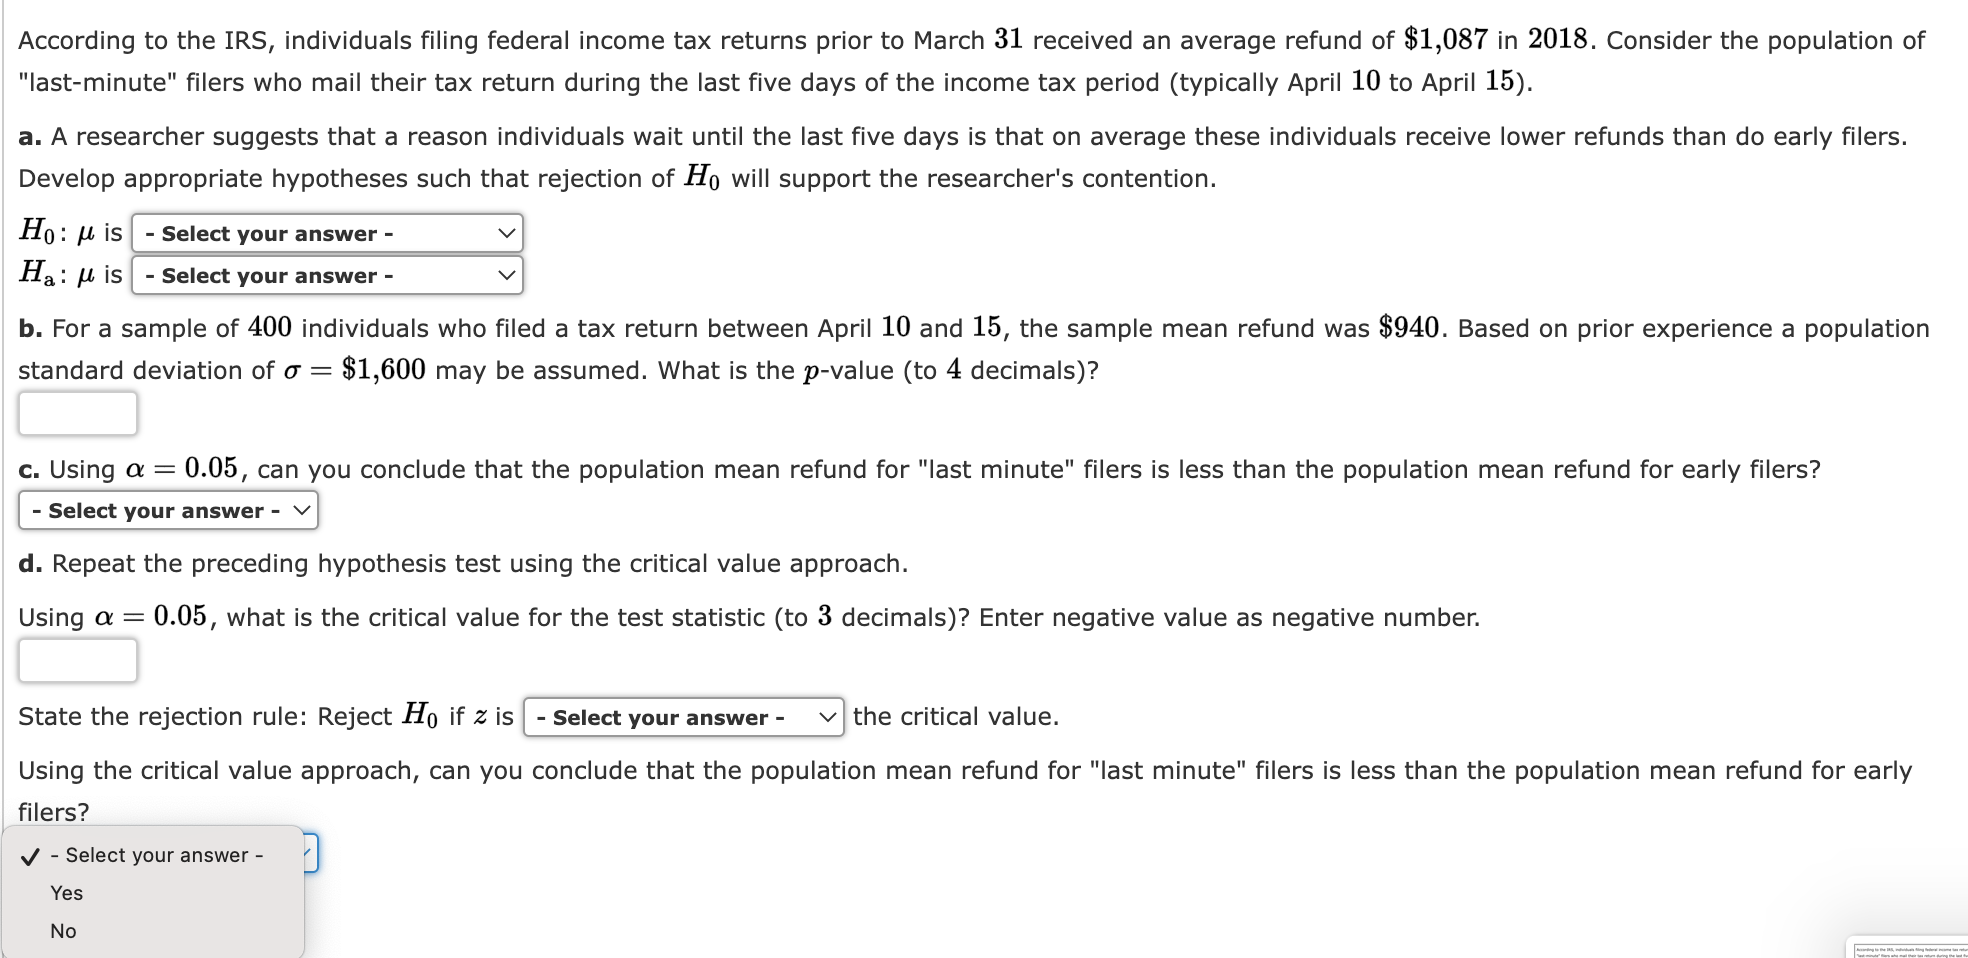
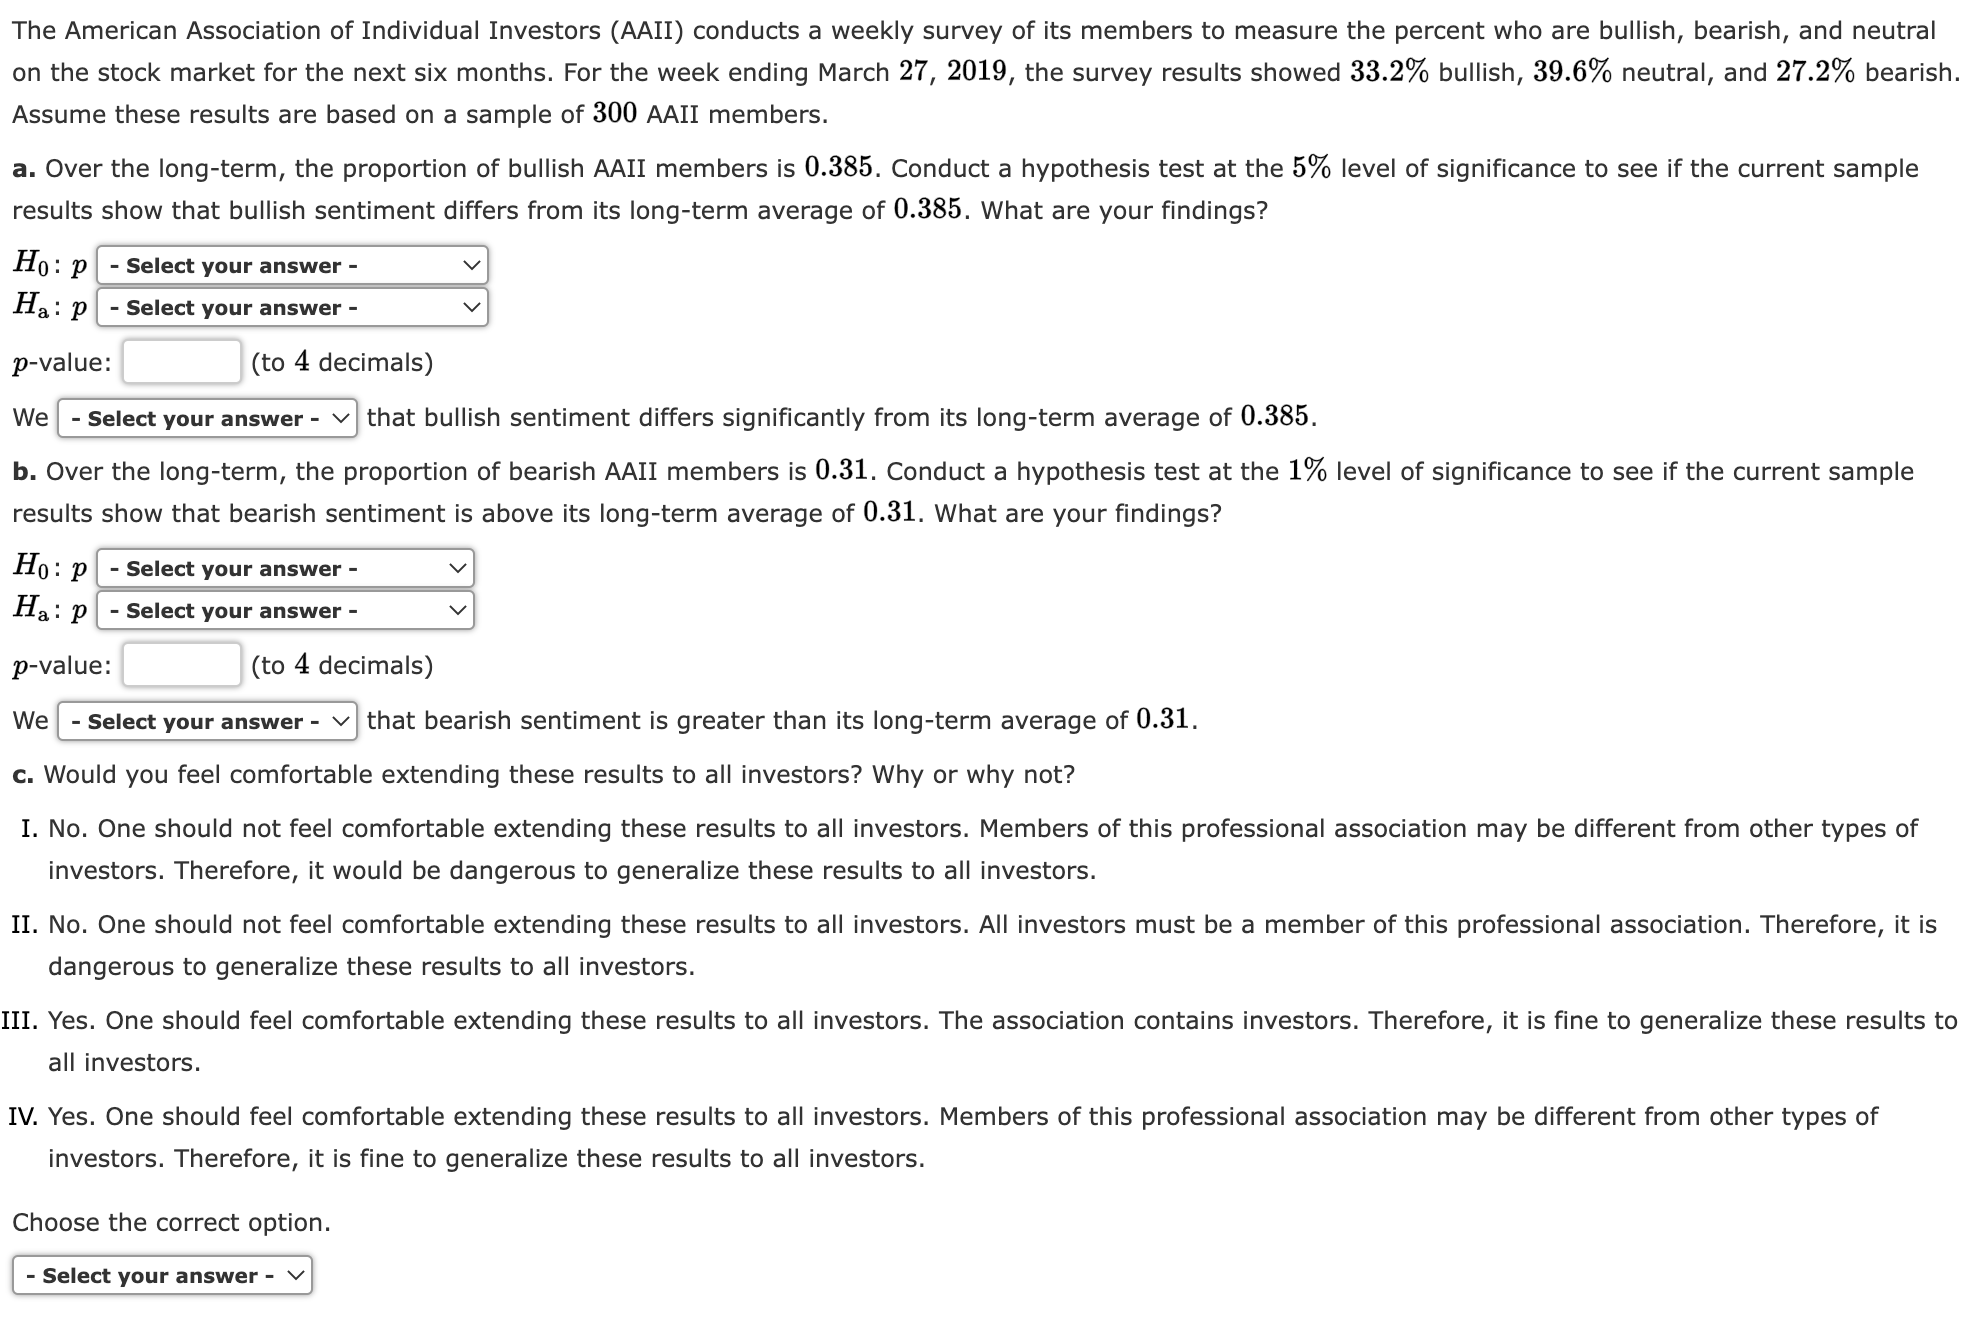
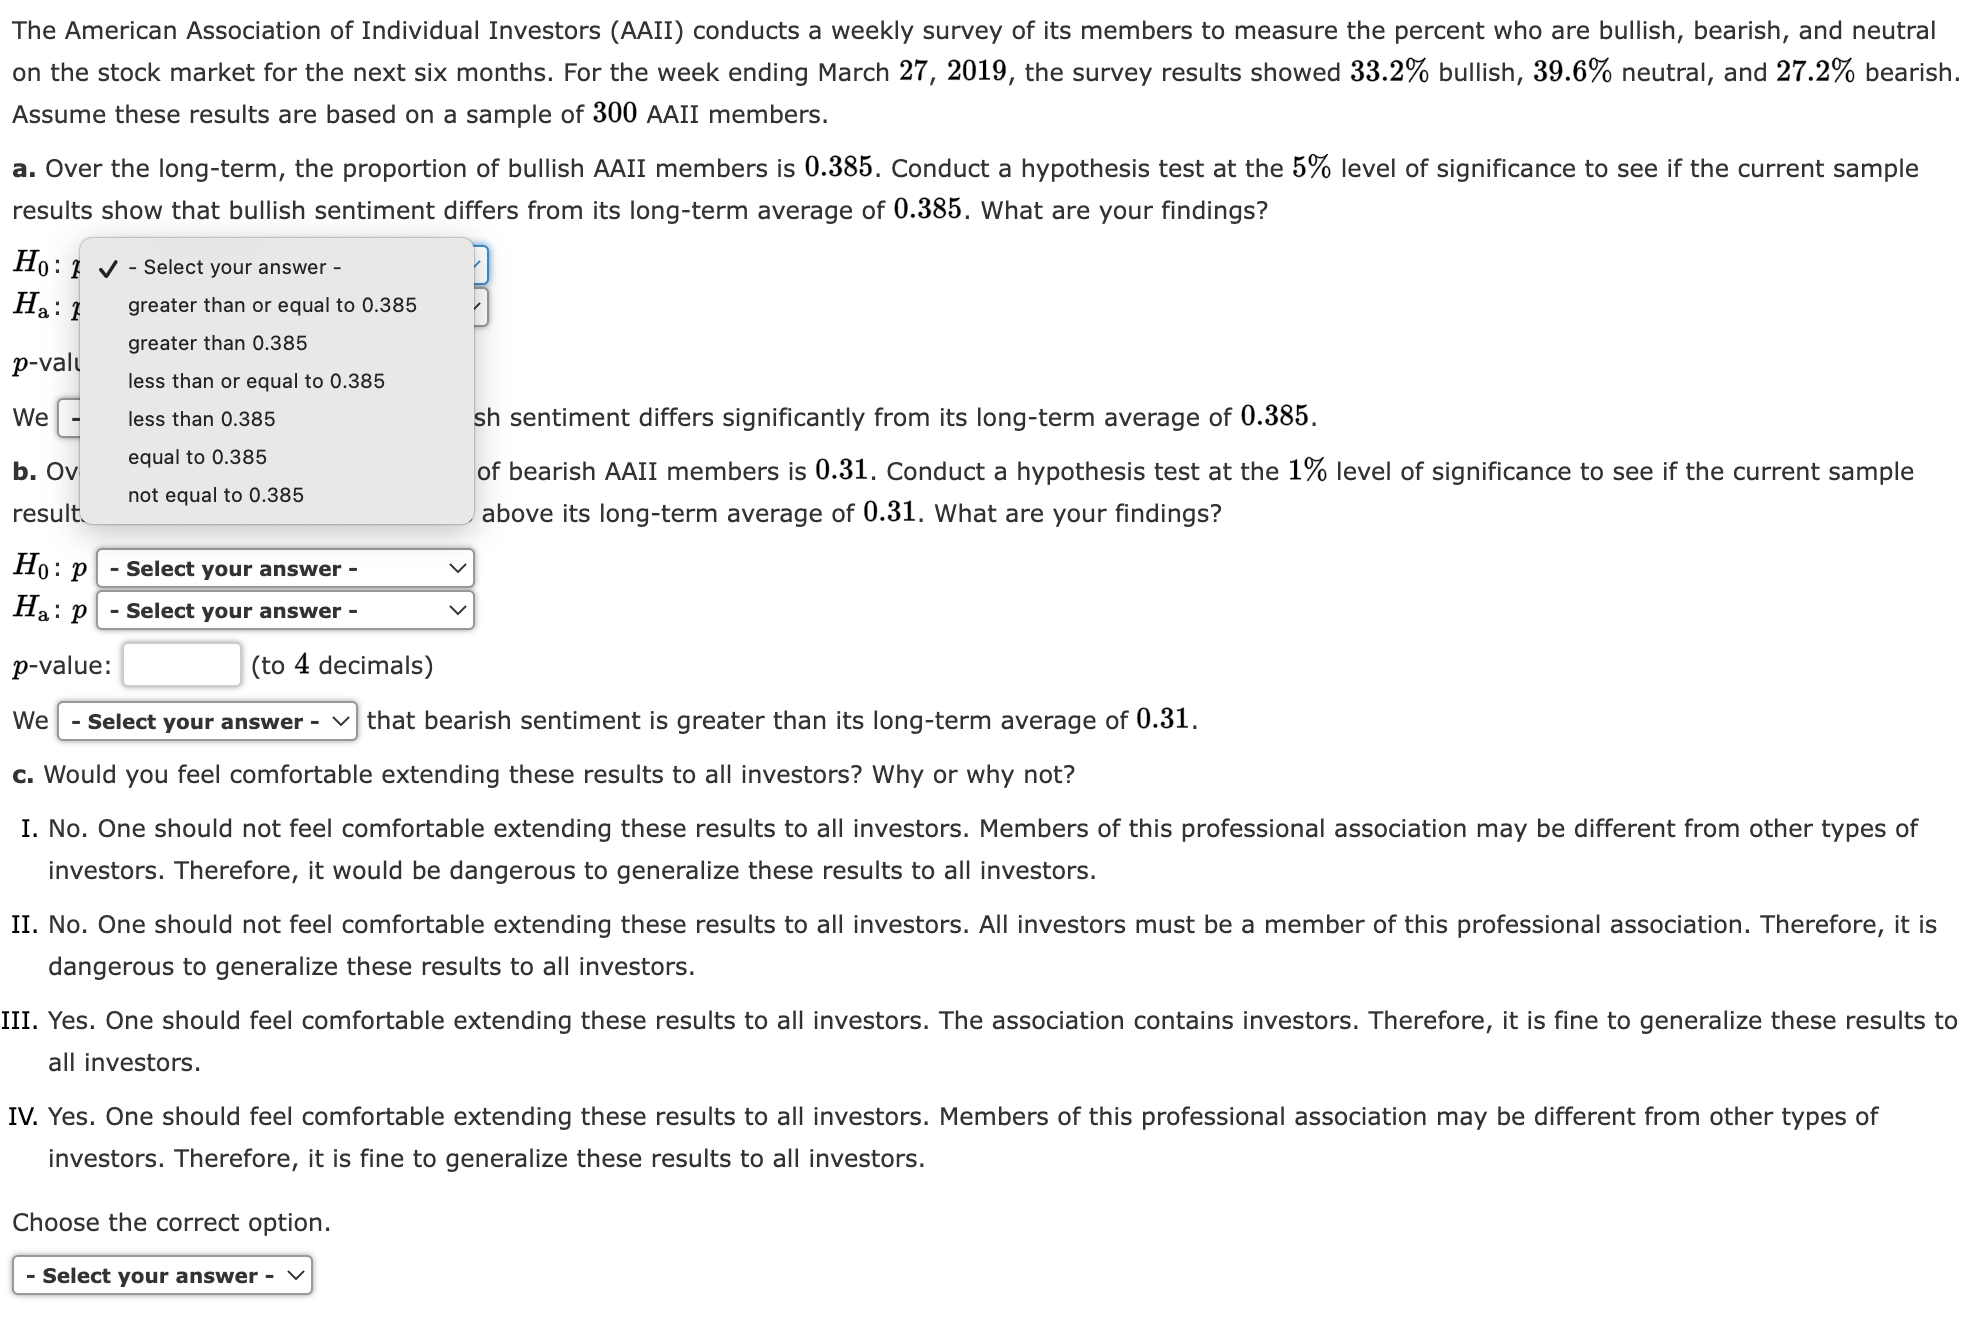
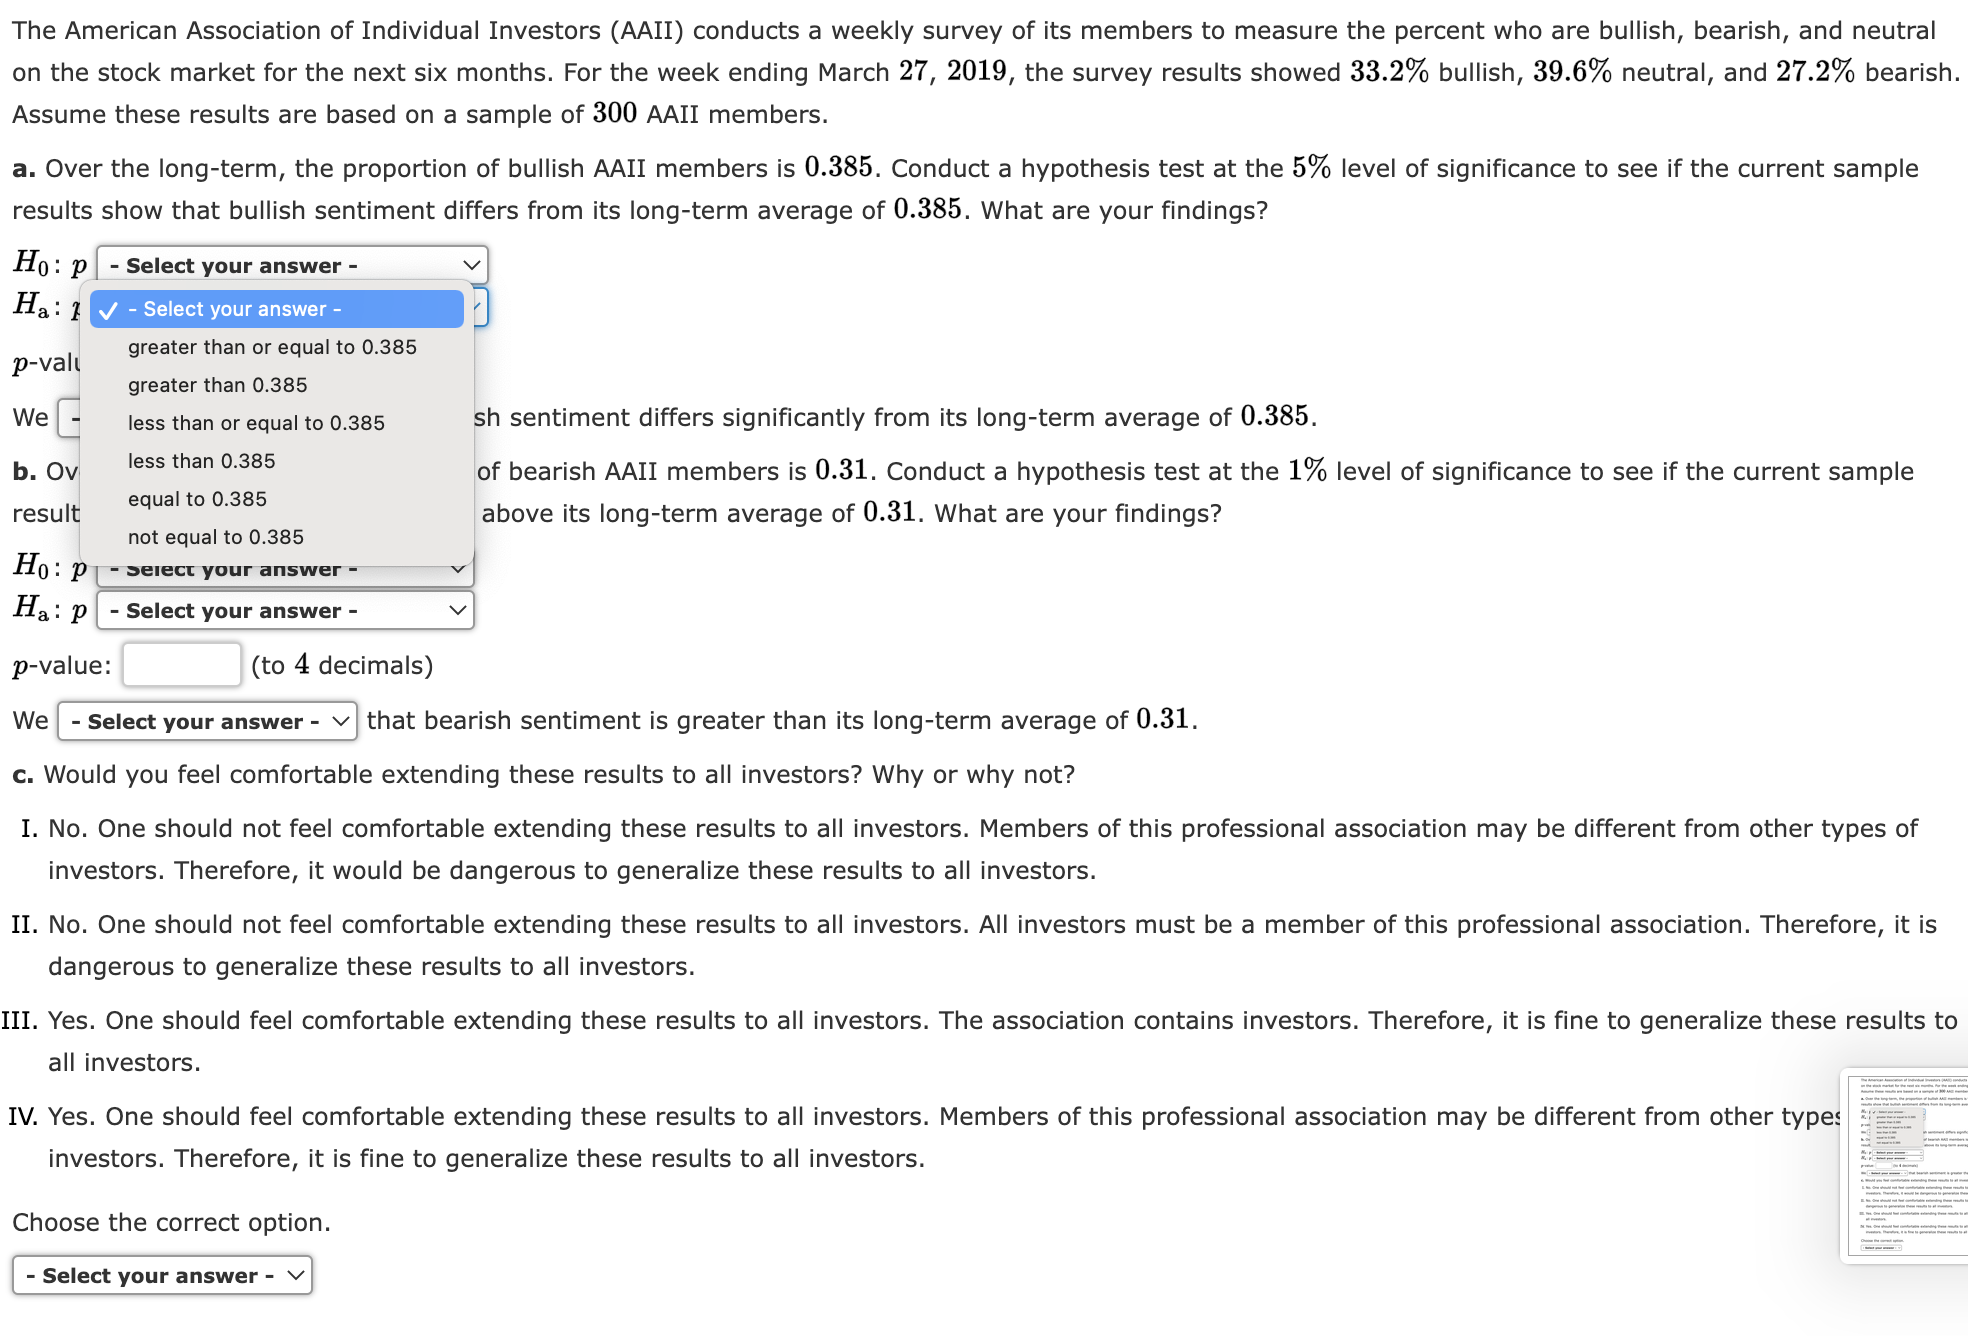
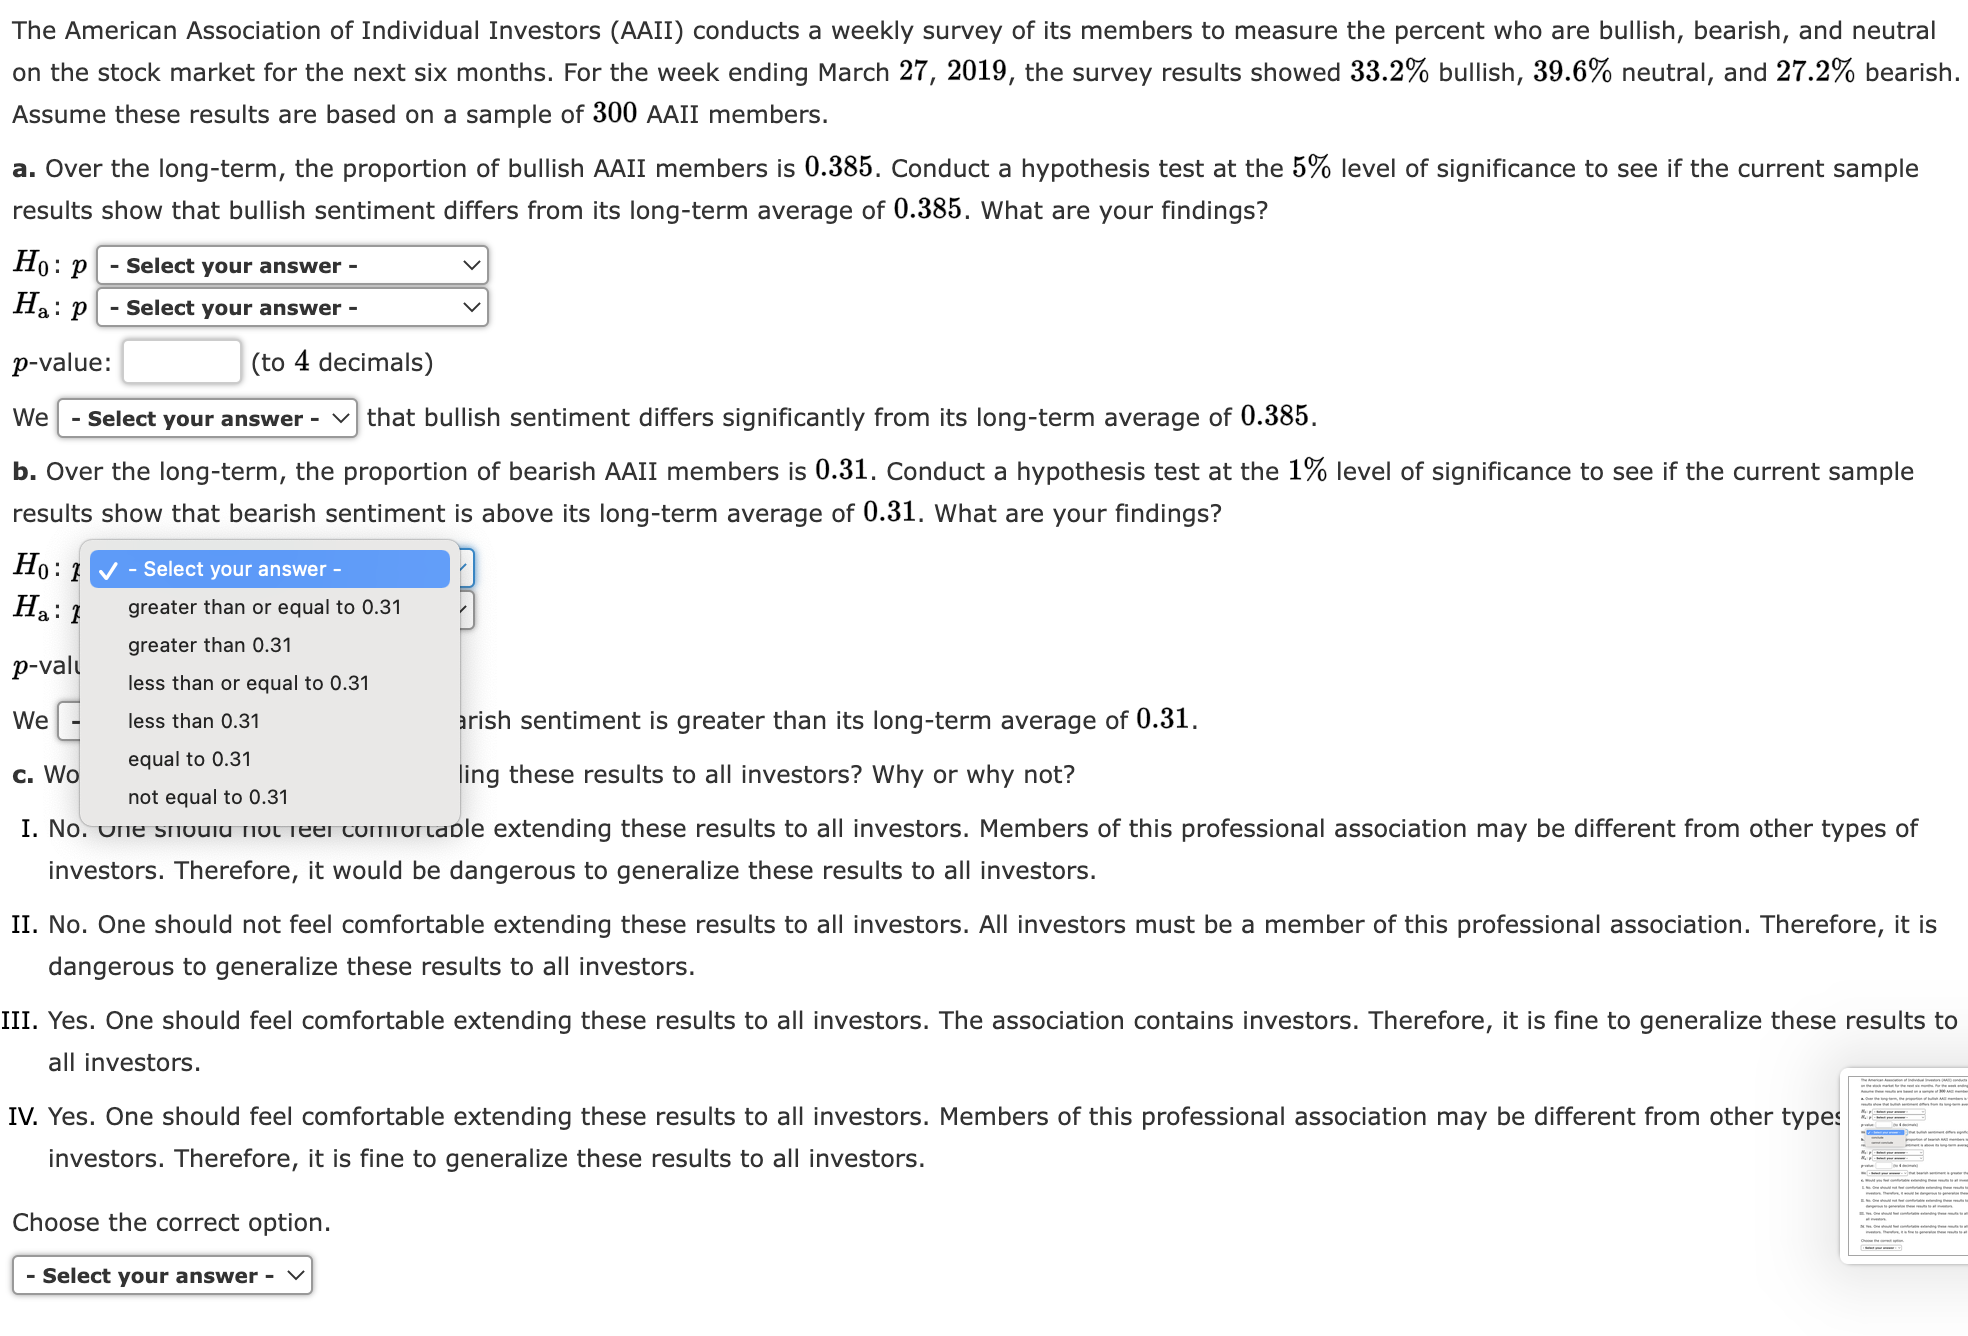
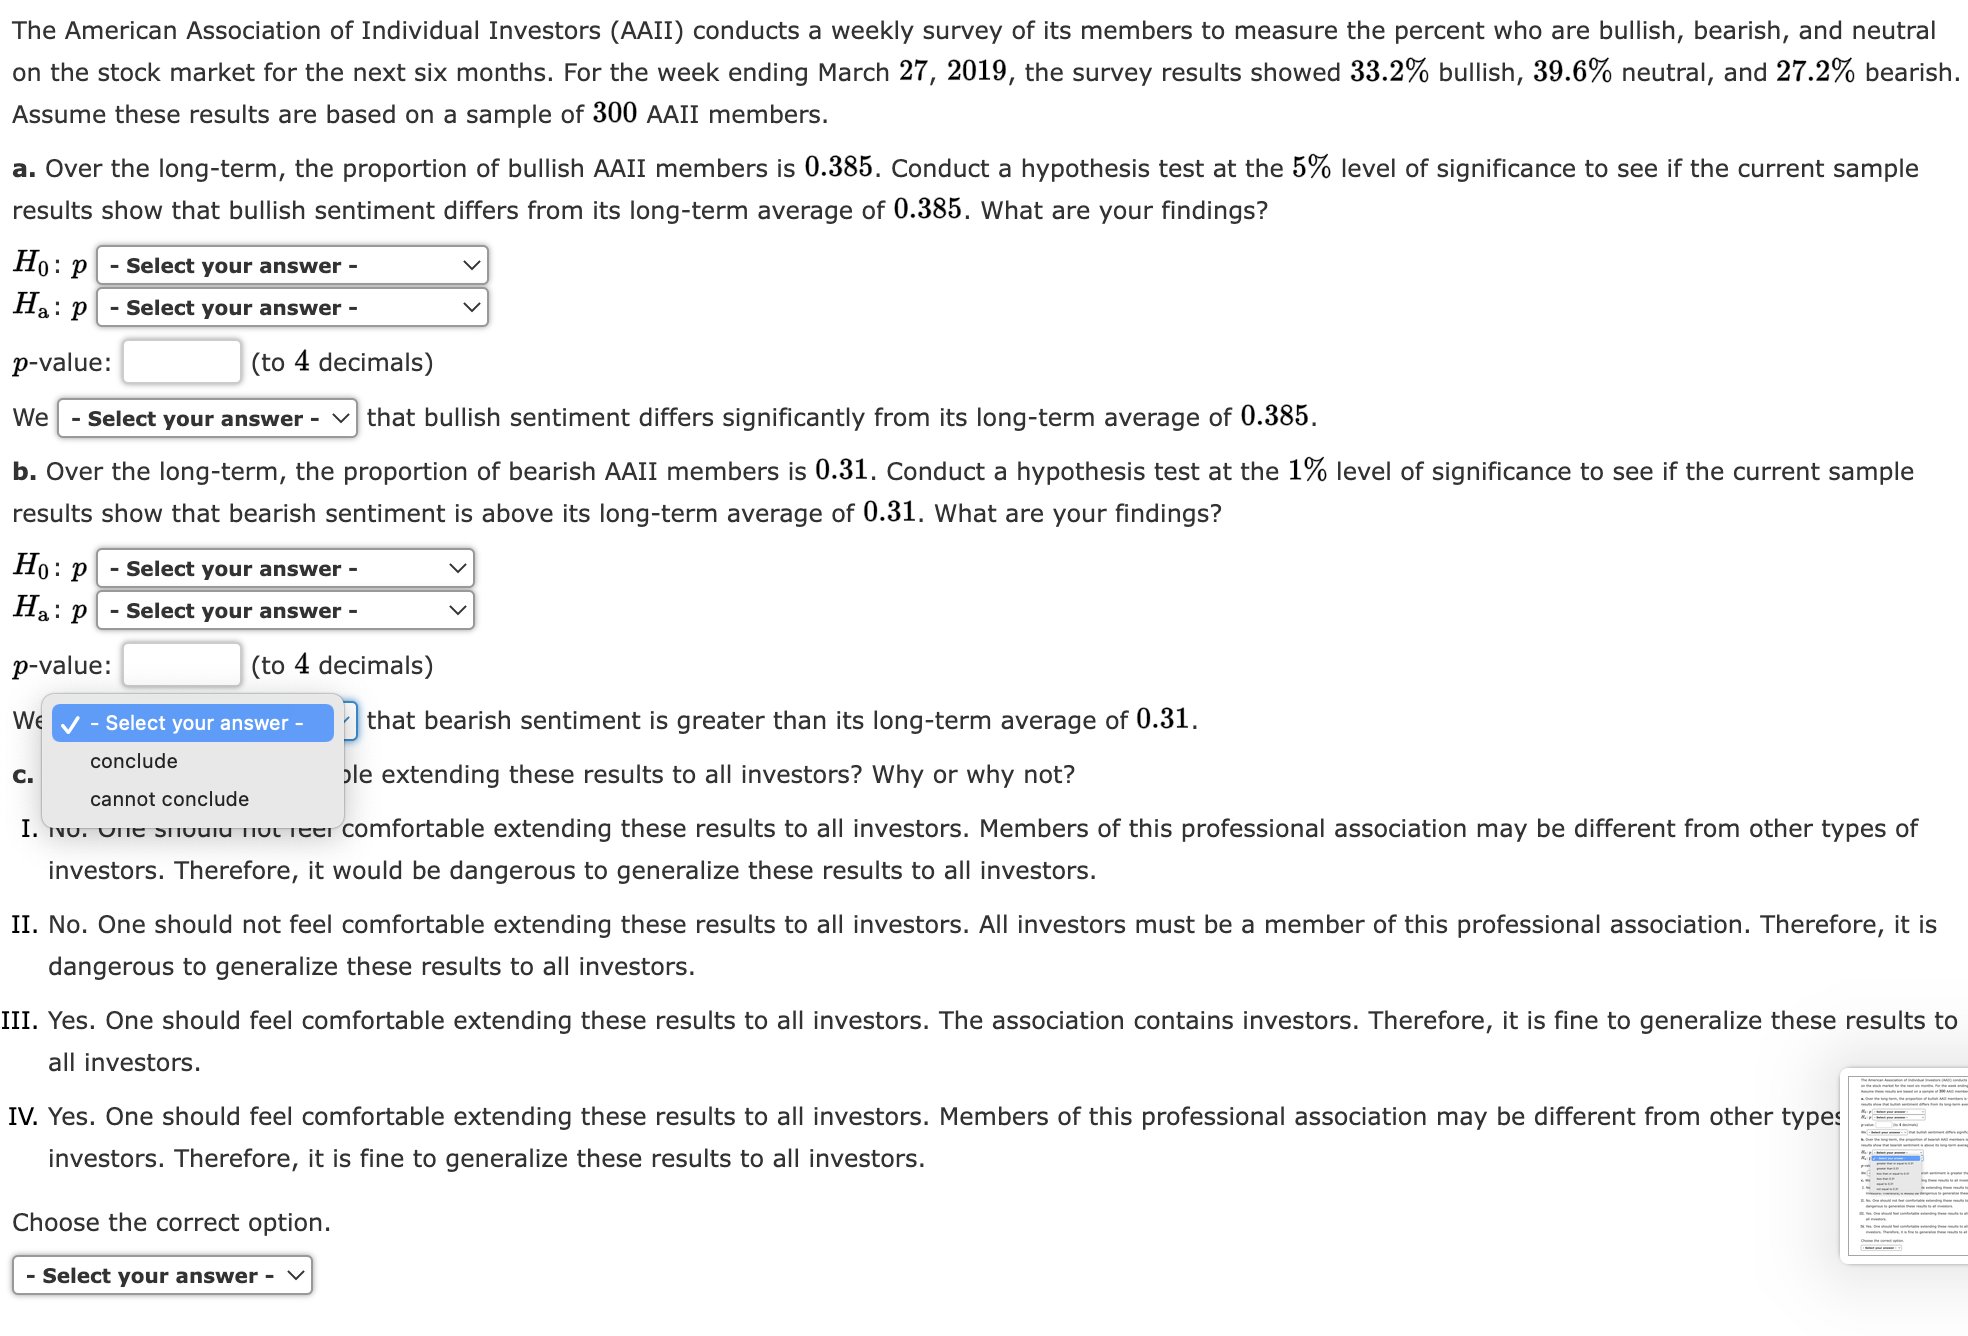
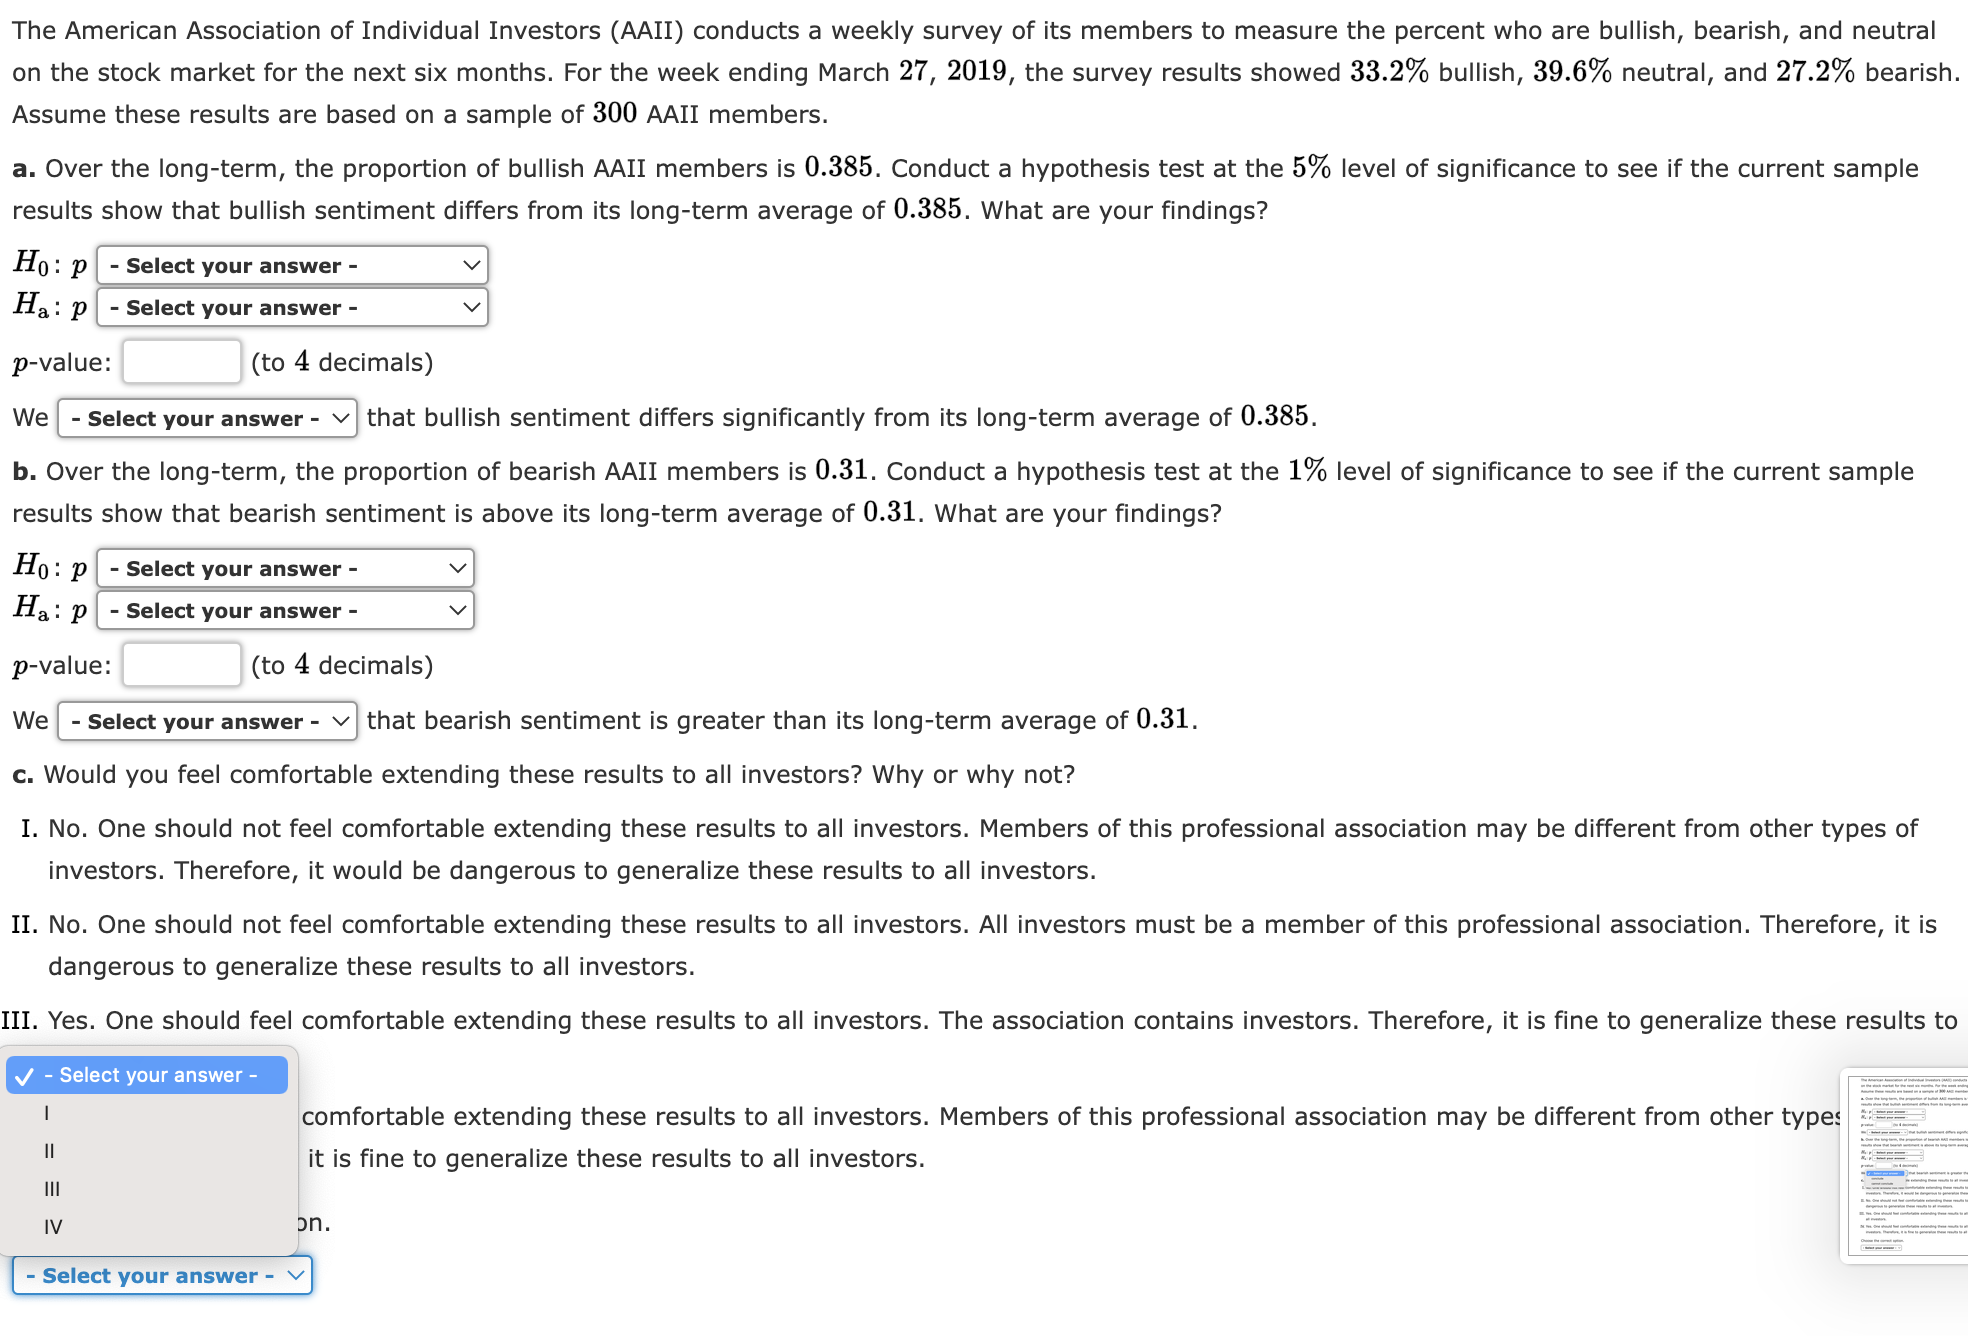
According to statistics reported on CNBC, a surprising number of motor vehicles are not covered by insurance. Sample results, consistent with the CNBC report, showed 38 of 171 vehicles were not covered by insurance. a. What is the point estimate of the proportion of vehicles not covered by insurance (to 4 decimals)? b. Develop a 90% confidence interval for the population proportion (to 4 decimals). ( . ) A sample survey of 56 discount brokers showed that the mean price charged for a trade of 100 shares at $50 per share was $33.78. The survey is conducted annually. With the historical data available, assume a known population standard deviation of $14. a. Using the sample data, what is the margin of error associated with a 99% confidence interval (to 2 decimals)? $ b. Develop a 99% confidence interval for the mean price charged by discount brokers for a trade of 100 shares at $50 per share (to 2 decimals). ($ .$ ) Joan's Nursery specializes in customdesigned landscaping for residential areas. The estimated labor cost associated with a particular landscaping proposal is based on the number of plantings of trees, shrubs, and so on to be used for the project. For cost estimating purposes, managers use two hours of labor time for the planting of a mediumsized tree. Actual times from a sample of 10 plantings during the past month follow (times in hours). 1.7 1.5 2.4 1.6 3.2 2.7 2.2 2.4 2.8 2.5 With a 0.05 level of significance, test to see whether the mean treeplanting time differs from two hours. a. State the null and alternative hypotheses. H. m 2 17a : p, -Select your answer- v 2 b. Compute the sample mean. (to 2 decimals) c. Compute the sample standard deviation. (to 4 decimals) d. Find the test statistic and pvalue. (Use Table 2 in Appendix B.) t (to 3 decimals) p-value - Select your answer - v e. What is your conclusion? We reject the null hypothesis. There enough evidence to prove that the mean treeplanting time differs from 2 hours. Joan's Nursery specializes in customdesigned landscaping for residential areas. The estimated labor cost associated with a particular landscaping proposal is based on the number of plantings of trees, shrubs, and so on to be used for the project. For cost estimating purposes, managers use two hours of labor time for the planting of a mediumsized tree. Actual times from a sample of 10 plantings during the past month follow (times in hours). 1.7 1.5 2.4 1.6 3.2 2.7 2.2 2.4 2.8 2.5 With a 0.05 level of significance, test to see whether the mean treeplanting time differs from two hours. a. State the null and alternative hypotheses. Ho : F J Select your answer 32 32 b. Corr 5 i 2 c. Com 3 d deviation. (to 4 decimals) d. Find the test statistic and pvalue. (Use Table 2 in Appendix B.) t (to 3 decimals) p-value - Select your answer - v e. What is your conclusion? We reject the null hypothesis. There enough evidence to prove that the mean treeplanting time difl 2 hours. Joan's Nursery specializes in customdesigned landscaping for residential areas. The estimated labor cost associated with a particular landscaping proposal is based on the number of plantings of trees, shrubs, and so on to be used for the project. For cost estimating purposes, managers use two hours of labor time for the planting of a mediumsized tree. Actual times from a sample of 10 plantings during the past month follow (times in hours). 1.7 1.5 2.4 1.6 3.2 2.7 2.2 2.4 2.8 2.5 With a 0.05 level of significance, test to see whether the mean treeplanting time differs from two hours. a. State the null and alternative hypotheses. H. m 2 1?a : ,4. J Select your answer 32 S c. Com 2 d deviation. 2 d. Find the test statistic and p-value. (Use Table 2 in Appendix B.) t (to 3 decimals) p-value - Select your answer - v e. What is your conclusion? We reject the null hypothesis. There enough evidence to prove that the mean treeplanting time difl 71 2 hours. Joan's Nursery specializes in customdesigned landscaping for residential areas. The estimated labor cost associated with a particular landscaping proposal is based on the number of plantings of trees, shrubs, and so on to be used for the project. For cost estimating purposes, managers use two hours of labor time for the planting of a mediumsized tree. Actual times from a sample of 10 plantings during the past month follow (times in hours). 1.7 1.5 2.4 1.6 3.2 2.7 2.2 2.4 2.8 2.5 With a 0.05 level of significance, test to see whether the mean treeplanting time differs from two hours. a. State the null and alternative hypotheses. H0 :p, -Select your answer- v 2 17a : p, - Select your answer- v 2 b. Compute the sample mean. (to 2 decimals) c. Compute the sample standard deviation. (to 4 decimals) d. Find the test statistic and pvalue. (Use Table 2 in Appendix B.) t (to 3 decimals) p-value J Select your answer Z] lower than 0.01 e' What between 0.01 and 0.025 We E between 0925 and 0'05 the null hypothesis. There enough evidence to prove that the mean treeplanting time differs from 2 hours. between 0.05 and 0.10 between 0.10 and 0.20 greater than 0.20 Joan's Nursery specializes in customdesigned landscaping for residential areas. The estimated labor cost associated with a particular landscaping proposal is based on the number of plantings of trees, shrubs, and so on to be used for the project. For cost estimating purposes, managers use two hours of labor time for the planting of a mediumsized tree. Actual times from a sample of 10 plantings during the past month follow (times in hours). 1.7 1.5 2.4 1.6 3.2 2.7 2.2 2.4 2.8 2.5 With a 0.05 level of significance, test to see whether the mean treeplanting time differs from two hours. a. State the null and alternative hypotheses. H0 :p, -Select your answer- v 2 Ha : p, - Select your answer- v 2 b. Compute the sample mean. (to 2 decimals) c. Compute the sample standard deviation. (to 4 decimals) d. Find the test statistic and pvalue. (Use Table 2 in Appendix B.) t (to 3 decimals) p-value - Select your answer - v e. What is your conclusion? We '/ Select your answer :] reject the null hypothesis. There enough evidence to prove that the mean treeplanting time di 2 I do not do Joan's Nursery specializes in customdesigned landscaping for residential areas. The estimated labor cost associated with a particular landscaping proposal is based on the number of plantings of trees, shrubs, and so on to be used for the project. For cost estimating purposes, managers use two hours of labor time for the planting of a mediumsized tree. Actual times from a sample of 10 plantings during the past month follow (times in hours). 1.7 1.5 2.4 1.6 3.2 2.7 2.2 2.4 2.8 2.5 With a 0.05 level of significance, test to see whether the mean treeplanting time differs from two hours. a. State the null and alternative hypotheses. H0 :p, -Select your answer- v 2 17a : p, - Select your answer- v 2 b. Compute the sample mean. (to 2 decimals) c. Compute the sample standard deviation. (to 4 decimals) d. Find the test statistic and pvalue. (Use Table 2 in Appendix B.) t (to 3 decimals) p-value - Select your answer - v e. What is your conclusion? We reject the null hypothesis. There \\/ Select your answer J enough evidence to prove that the mean treeplanting time difi 1 2 hours. is not is According to the IRS, individuals filing federal income tax returns prior to March 31 received an average refund of $1,087 in 2018. Consider the population of "lastminute" filers who mail their tax return during the last five days of the income tax period (typically April 10 to April 15). a. A researcher suggests that a reason individuals wait until the last five days is that on average these individuals receive lower refunds than do early filers. Develop appropriate hypotheses such that rejection of Ho will support the researcher's contention. H0: p is - Select your answer - V Ha: ,u is - Select your answer - V b. For a sample of 400 individuals who filed a tax return between April 10 and 15, the sample mean refund was $940. Based on prior experience a population standard deviation of 0' = $1,600 may be assumed. What is the pvalue (to 4 decimals)? c. Using a = 0.05, can you conclude that the population mean refund for "last minute" filers is less than the population mean refund for early filers? - Select your answer - V d. Repeat the preceding hypothesis test using the critical value approach. Using a = 0.05, what is the critical value for the test statistic (to 3 decimals)? Enter negative value as negative number. State the rejection rule: Reject Ho if z is the critical value. Using the critical value approach, can you conclude that the population mean refund for "last minute" filers is less than the population mean refund for early filers? - Select your answer - V According to the IRS, individuals filing federal income tax returns prior to March 31 received an average refund of $1,087 in 2018. Consider the population of "lastminute" filers who mail their tax return during the last five days of the income tax period (typically April 10 to April 15). a. A researcher suggests that a reason individuals wait until the last five days is that on average these individuals receive lower refunds than do early filers. Develop appropriate hypotheses such that rejection of Ho will support the researcher's contention. H0: p i! J Selecl your answer % Ha: M is greater than or equal to 1,087 greater than 1,087 _ _ _ _ b. For a led a tax return between April 10 and 15, the sample mean refund was $940. Based on prior experience a population less than or equal "31,087 standar e assumed. What is the value to 4 decimals '? '. less than 1,087 P ( ) ' equal to 1,087 c. Using "0' equa' \"1:037 It the population mean refund for "last minute" filers is less than the population mean refund for early filers? - Select your answer - v d. Repeat the preceding hypothesis test using the critical value approach. Using a = 0.05, what is the critical value for the test statistic (to 3 decimals)? Enter negative value as negative number. State the rejection rule: Reject Hg if z is the critical value. Using the critical value approach, can you conclude that the population mean refund for "last minute" filers is less than the population mean refund for early filers? - Select your answer - V According to the IRS, individuals filing federal income tax returns prior to March 31 received an average refund of $1,087 in 2018. Consider the population of "lastminute" filers who mail their tax return during the last five days of the income tax period (typically April 10 to April 15). a. A researcher suggests that a reason individuals wait until the last five days is that on average these individuals receive lower refunds than do early filers. Develop appropriate hypotheses such that rejection of Ho will support the researcher's contention. H0: p is - Select your answer - V Ha: ,u is J - Select your answer- ' greater than or equal to 1,087 b. For a led a tax return between April 10 and 15, the sample mean refund was $940. Based on prior experience a population standart gleaterthan 1'087 e assumed. What is the pvalue (to 4 decimals)? ' less than or equal to 1,087 less than 1,087 c. Using Bqualto 1.087 It the population mean refund for "last minute" filers is less than the population mean refund for early filers? - Select not equal to 1,087 d. Repeat the preceding hypothesis test using the critical value approach. Using a = 0.05, what is the critical value for the test statistic (to 3 decimals)? Enter negative value as negative number. State the rejection rule: Reject Hg if z is the critical value. Using the critical value approach, can you conclude that the population mean refund for "last minute" filers is less than the population mean refund for early filers? - Select your answer - V According to the IRS, individuals filing federal income tax returns prior to March 31 received an average refund of $1,087 in 2018. Consider the population of "lastminute" filers who mail their tax return during the last five days of the income tax period (typically April 10 to April 15). a. A researcher suggests that a reason individuals wait until the last five days is that on average these individuals receive lower refunds than do early filers. Develop appropriate hypotheses such that rejection of Ho will support the researcher's contention. H0: p is - Select your answer - V Ha: M is - Select your answer - v b. For a sample of 400 individuals who filed a tax return between April 10 and 15, the sample mean refund was $940. Based on prior experience a population standard deviation of 0' = $1,600 may be assumed. What is the pvalue (to 4 decimals)? c. Using a = 0.05, can you conclude that the population mean refund for "last minute" filers is less than the population mean refund for early filers? J - Select your answer - Z] Yes | hypothesis test using the critical value approach. No ' using u u.w, WllaL IS the critical value for the test statistic (to 3 decimals)? Enter negative value as negative number. State the rejection rule: Reject Ho if z is the critical value. Using the critical value approach, can you conclude that the population mean refund for "last minute" filers is less than the population mean refund for early filers? - Select your answer - V According to the IRS, individuals filing federal income tax returns prior to March 31 received an average refund of $1,087 in 2018. Consider the population of "lastminute" filers who mail their tax return during the last five days of the income tax period (typically April 10 to April 15). a. A researcher suggests that a reason individuals wait until the last five days is that on average these individuals receive lower refunds than do early filers. Develop appropriate hypotheses such that rejection of Ho will support the researcher's contention. H0: p is - Select your answer - V Ha: ,u is - Select your answer - v b. For a sample of 400 individuals who filed a tax return between April 10 and 15, the sample mean refund was $940. Based on prior experience a population standard deviation of 0' = $1,600 may be assumed. What is the pvalue (to 4 decimals)? c. Using a = 0.05, can you conclude that the population mean refund for "last minute" filers is less than the population mean refund for early filers? - Select your answer - v d. Repeat the preceding hypothesis test using the critical value approach. Using a = 0.05, what is the critical value for the test statistic (to 3 decimals)? Enter negative value as negative number. State the rejection rule: Reject Ho if z i: _Z] the critical value. greater than or equal to Using the critical value approach, can yo tion mean refund for "last minute" filers is less than the population mean refund for early . greater than fl lers? less than or equal to - Select your answer - V less than equalto not equal to According to the IRS, individuals filing federal income tax returns prior to March 31 received an average refund of $1,087 in 2018. Consider the population of "lastminute" filers who mail their tax return during the last five days of the income tax period (typically April 10 to April 15). a. A researcher suggests that a reason individuals wait until the last five days is that on average these individuals receive lower refunds than do early filers. Develop appropriate hypotheses such that rejection of Ho will support the researcher's contention. H0: p is - Select your answer - V Ha: ,u is - Select your answer - V b. For a sample of 400 individuals who filed a tax return between April 10 and 15, the sample mean refund was $940. Based on prior experience a population standard deviation of 0' = $1,600 may be assumed. What is the pvalue (to 4 decimals)? c. Using a = 0.05, can you conclude that the population mean refund for "last minute" filers is less than the population mean refund for early filers? - Select your answer - v d. Repeat the preceding hypothesis test using the critical value approach. Using a = 0.05, what is the critical value for the test statistic (to 3 decimals)? Enter negative value as negative number. State the rejection rule: Reject Ho if z is the critical value. Using the critical value approach, can you conclude that the population mean refund for "last minute" filers is less than the population mean refund for early filers? \\/ Select your answer Z] Yes NO A simple random sample with n = 50 provided a sample mean of 23.5 and a sample standard deviation of 4.1. 3. Develop a 90% confidence interval for the population mean (to 1 decimal). ( , ) b. Develop a 95% confidence interval for the population mean (to 1 decimal). ( , ) c. Develop a 99% confidence interval for the population mean (to 1 decimal). ( , ) d. What happens to the margin of error and the condence interval as the confidence level is increased? - Select your answer - v . 09 Icon Key A simple random sample with n = 50 provided a sample mean of 23.5 and a sample standard deviation of 4.1. 3. Develop a 90% confidence interval for the population mean (to 1 decimal). ( , ) b. Develop a 95% confidence interval for the population mean (to 1 decimal). l , ) c. Develop a 99% confidence interval for the population mean (to 1 decimal). ( , ) d. What happens to the margin of error and the condence interval as the confidence level is increased? J - Select your answer - a . They increase They decrease They stay the same It cannot be determined from the given data The margin of error increases and the confidence interval becomes narrower The margin of error decreases and the confidence interval becomes wider The American Association of Individual Investors (AAII) conducts a weekly survey of its members to measure the percent who are bullish, bearish, and neutral on the stock market for the next six months. For the week ending March 27, 2019, the survey results showed 33.2% bullish, 39.6% neutral, and 27.2% bearish. Assume these results are based on a sample of 300 AAII members. a. Over the longterm, the proportion of bullish AAII members is 0.385. Conduct a hypothesis test at the 5% level of significance to see if the current sample results show that bullish sentiment differs from its long-term average of 0.385. What are your findings? H... ,, H3: 1) - Select your answer - V pvalue: (to 4 decimals) We that bullish sentiment differs signicantly from its longterm average of 0.385. b. Over the long-term, the proportion of bearish AAII members is 0.31. Conduct a hypothesis test at the 1% level of significance to see if the current sample results show that bearish sentiment is above its longterm average of 0.31. What are your findings? H0: 1) - Select your answer - v H... ,, p-value: (to 4 decimals) We that bearish sentiment is greater than its longterm average of 0.31. c. Would you feel comfortable extending these results to all investors? Why or why not? I. No. One should not feel comfortable extending these results to all investors. Members of this professional association may be different from other types of investors. Therefore, it would be dangerous to generalize these results to all investors. II. No. One should not feel comfortable extending these results to all investors. All investors must be a member of this professional association. Therefore, it is dangerous to generalize these results to all investors. 111. Yes. One should feel comfortable extending these results to all investors. The association contains investors. Therefore, it is ne to generalize these results to all investors. IV. Yes. One should feel comfortable extending these results to all investors. Members of this professional association may be different from other types of investors. Therefore, it is fine to generalize these results to all investors. Choose the correct option. - Select your answer - v The American Association of Individual Investors (AAII) conducts a weekly survey of its members to measure the percent who are bullish, bearish, and neutral on the stock market for the next six months. For the week ending March 27, 2019, the survey results showed 33.2% bullish, 39.6% neutral, and 27.2% bearish. Assume these results are based on a sample of 300 AAII members. a. Over the longterm, the proportion of bullish AAII members is 0.385. Conduct a hypothesis test at the 5% level of significance to see if the current sample results show that bullish sentiment differs from its long-term average of 0.385. What are your findings? H0: 1 J - Select your answer - ' Ha; I greater than or equal to 0.335 I greater than 0.385 pvalt less than or equal to 0.385 We E less than 0.385 sh sentiment differs signicantly from its longterm average of 0.385. It 0385 _ . . . . . . b. Ov' aqua 0 of bearish AAII members IS 0.31. Conduct a hypothesrs test at the 1% level of Signicance to see If the current sample not equal to 0.385 _ . _ result. above Its longterm average of 0.31. What are your findings? H0: 1) - Select your answer - v H... ,, p-value: (to 4 decimals) We that bearish sentiment is greater than its longterm average of 0.31. c. Would you feel comfortable extending these results to all investors? Why or why not? I. No. One should not feel comfortable extending these results to all investors. Members of this professional association may be different from other types of investors. Therefore, it would be dangerous to generalize these results to all investors. II. No. One should not feel comfortable extending these results to all investors. All investors must be a member of this professional association. Therefore, it is dangerous to generalize these results to all investors. 111. Yes. One should feel comfortable extending these results to all investors. The association contains investors. Therefore, it is ne to generalize these results to all investors. IV. Yes. One should feel comfortable extending these results to all investors. Members of this professional association may be different from other types of investors. Therefore, it is fine to generalize these results to all investors. Choose the correct option. - Select your answer - v The American Association of Individual Investors (AAII) conducts a weekly survey of its members to measure the percent who are bullish, bearish, and neutral on the stock market for the next six months. For the week ending March 27, 2019, the survey results showed 33.2% bullish, 39.6% neutral, and 27.2% bearish. Assume these results are based on a sample of 300 AAII members. a. Over the longterm, the proportion of bullish AAII members is 0.385. Conduct a hypothesis test at the 5% level of significance to see if the current sample results show that bullish sentiment differs from its long-term average of 0.385. What are your findings? H0 I P - Select your an5wer - v Ha: I \\l Select your answer . greater than or equal to 0.385 p-Vall greater than 0.385 We E less than or equal to 0.335 sh sentiment differs signicantly from its longterm average of 0.385. b. Ovl "355th\" 0385 of bearish AAII members is 0.31. Conduct a hypothesis test at the 1% level of significance to see if the current sample result equal to 03% above its longterm average of 0.31. What are your findings? not equal to 0.385 H0: [)1 - aenec: your answer - v H... ,, p-value: (to 4 decimals) We that bearish sentiment is greater than its longterm average of 0.31. c. Would you feel comfortable extending these results to all investors? Why or why not? I. No. One should not feel comfortable extending these results to all investors. Members of this professional association may be different from other types of investors. Therefore, it would be dangerous to generalize these results to all investors. II. No. One should not feel comfortable extending these results to all investors. All investors must be a member of this professional association. Therefore, it is dangerous to generalize these results to all investors. 111. Yes. One should feel comfortable extending these results to all investors. The association contains investors. Therefore, it is ne to generalize these results to all investors. IV. Yes. One should feel comfortable extending these results to all investors. Members of this professional association may be different from other types investors. Therefore, it is fine to generalize these results to all investors. Choose the correct option. - Select your answer - v The American Association of Individual Investors (AAII) conducts a weekly survey of its members to measure the percent who are bullish, bearish, and neutral on the stock market for the next six months. For the week ending March 27, 2019, the survey results showed 33.2% bullish, 39.6% neutral, and 27.2% bearish. Assume these results are based on a sample of 300 AAII members. a. Over the longterm, the proportion of bullish AAII members is 0.385. Conduct a hypothesis test at the 5% level of significance to see if the current sample results show that bullish sentiment differs from its long-term average of 0.385. What are your findings? H... ,, H3: 12 - Select your answer - V pvalue: (to 4 decimals) WE :] that bullish sentiment differs signicantly from its longterm average of 0.385. b. consume proportion of bearish AAII members is 0.31. Conduct a hypothesis test at the 1% level of significance to see if the current sample cannot conclude ' _ _ . _ re: entiment IS above Its longterm average of 0.31. What are your findings? H0: 1) - Select your answer - v H... ,, p-value: (to 4 decimals) We that bearish sentiment is greater than its longterm average of 0.31. c. Would you feel comfortable extending these results to all investors? Why or why not? I. No. One should not feel comfortable extending these results to all investors. Members of this professional association may be different from other types of investors. Therefore, it would be dangerous to generalize these results to all investors. II. No. One should not feel comfortable extending these results to all investors. All investors must be a member of this professional association. Therefore, it is dangerous to generalize these results to all investors. 111. Yes. One should feel comfortable extending these results to all investors. The association contains investors. Therefore, it is ne to generalize these results to all investors. IV. Yes. One should feel comfortable extending these results to all investors. Members of this professional association may be different from other types investors. Therefore, it is fine to generalize these results to all investors. Choose the correct option. - Select your answer - v The American Association of Individual Investors (AAII) conducts a weekly survey of its members to measure the percent who are bullish, bearish, and neutral on the stock market for the next six months. For the week ending March 27, 2019, the survey results showed 33.2% bullish, 39.6% neutral, and 27.2% bearish. Assume these results are based on a sample of 300 AAII members. a. Over the longterm, the proportion of bullish AAII members is 0.385. Conduct a hypothesis test at the 5% level of significance to see if the current sample results show that bullish sentiment differs from its long-term average of 0.385. What are your findings? H... ,, H3: 12 - Select your answer - V pvalue: (to 4 decimals) We that bullish sentiment differs signicantly from its longterm average of 0.385. b. Over the long-term, the proportion of bearish AAII members is 0.31. Conduct a hypothesis test at the 1% level of significance to see if the current sample results show that bearish sentiment is above its longterm average of 0.31. What are your findings? JimI 1 / Hal greater than or equal to 0.31 greater than 0.31 p-Vall less than or equal to 0.31 We E less than 0.31 arish sentiment is greater than its longterm average of 0.31. e ual to 0.31 , . c. We q ling these results to all Investors? Why or why not? not equal to 0.31 I. No. um: 5\"!)qu IIUL nee: L'umlurLdDIe extending these results to all investors. Members of this professional association may be different from other types of investors. Therefore, it would be dangerous to generalize these results to all investors. II. No. One should not feel comfortable extending these results to all investors. All investors must be a member of this professional association. Therefore, it is dangerous to generalize these results to all investors. 111. Yes. One should feel comfortable extending these results to all investors. The association contains investors. Therefore, it is ne to generalize these results to all investors. IV. Yes. One should feel comfortable extending these results to all investors. Members of this professional association may be different from other types investors. Therefore, it is fine to generalize these results to all investors. Choose the correct option. - Select your answer - v The American Association of Individual Investors (AAII) conducts a weekly survey of its members to measure the percent who are bullish, bearish, and neutral on the stock market for the next six months. For the week ending March 27, 2019, the survey results showed 33.2% bullish, 39.6% neutral, and 27.2% bearish. Assume these results are based on a sample of 300 AAII members. a. Over the longterm, the proportion of bullish AAII members is 0.385. Conduct a hypothesis test at the 5% level of significance to see if the current sample results show that bullish sentiment differs from its long-term average of 0.385. What are your findings? H... ,, H3: 12 - Select your answer - V pvalue: (to 4 decimals) We that bullish sentiment differs signicantly from its longterm average of 0.385. b. Over the long-term, the proportion of bearish AAII members is 0.31. Conduct a hypothesis test at the 1% level of significance to see if the current sample results show that bearish sentiment is above its longterm average of 0.31. What are your findings? H0 : p - Select your answer - v Ha: 1 J Select your answer I greater than or equal to 0.31 p-valt greater than 0.31 We E I935 than orequa| to 0.31 arish sentiment is greater than its longterm average of 0.31. c. Wo lessthan 0'31 ling these results to all investors? Why or why not? equal to 0.31 I. No DIE extending these results to all investors. Members of this professional association may be different from other types of not equal to 0.31 inVesLurs. inereiure, lL WUulu ue dangerous to generalize these results to all investors. II. No. One should not feel comfortable extending these results to all investors. All investors must be a member of this professional association. Therefore, it is dangerous to generalize these results to all investors. 111. Yes. One should feel comfortable extending these results to all investors. The association contains investors. Therefore, it is ne to generalize these results to all investors. IV. Yes. One should feel comfortable extending these results to all investors. Members of this professional association may be different from other types investors. Therefore, it is fine to generalize these results to all investors. Choose the correct option. - Select your answer - v The American Association of Individual Investors (AAII) conducts a weekly survey of its members to measure the percent who are bullish, bearish, and neutral on the stock market for the next six months. For the week ending March 27, 2019, the survey results showed 33.2% bullish, 39.6% neutral, and 27.2% bearish. Assume these results are based on a sample of 300 AAII members. a. Over the longterm, the proportion of bullish AAII members is 0.385. Conduct a hypothesis test at the 5% level of significance to see if the current sample results show that bullish sentiment differs from its long-term average of 0.385. What are your findings? H... ,, H3: 12 - Select your answer - V pvalue: (to 4 decimals) We that bullish sentiment differs signicantly from its longterm average of 0.385. b. Over the long-term, the proportion of bearish AAII members is 0.31. Conduct a hypothesis test at the 1% level of significance to see if the current sample results show that bearish sentiment is above its longterm average of 0.31. What are your findings? H0: 1) - Select your answer - v H... ,, p-value: (to 4 decimals) WE j that bearish sentiment is greater than its longterm average of 0.31. c. conc'uae )le extending these results to all investors? Why or why not? cannot conclude I. Ivu. um: snumu lIUL .ee. comfortable extending these results to all investors. Members of this professional association may be different from other types of investors. Therefore, it would be dangerous to generalize these results to all investors. II. No. One should not feel comfortable extending these results to all investors. All investors must be a member of this professional association. Therefore, it is dangerous to generalize these results to all investors. 111. Yes. One should feel comfortable extending these results to all investors. The association contains investors. Therefore, it is ne to generalize these results to all investors. IV. Yes. One should feel comfortable extending these results to all investors. Members of this professional association may be different from other types investors. Therefore, it is fine to generalize these results to all investors. Choose the correct option. - Select your answer - v The American Association of Individual Investors (AAII) conducts a weekly survey of its members to measure the percent who are bullish, bearish, and neutral on the stock market for the next six months. For the week ending March 27, 2019, the survey results showed 33.2% bullish, 39.6% neutral, and 27.2% bearish. Assume these results are based on a sample of 300 AAII members. a. Over the longterm, the proportion of bullish AAII members is 0.385. Conduct a hypothesis test at the 5% level of significance to see if the current sample results show that bullish sentiment differs from its long-term average of 0.385. What are your findings? H... ,, H3: 12 - Select your answer - V pvalue: (to 4 decimals) We that bullish sentiment differs signicantly from its longterm average of 0.385. b. Over the long-term, the proportion of bearish AAII members is 0.31. Conduct a hypothesis test at the 1% level of significance to see if the current sample results show that bearish sentiment is above its longterm average of 0.31. What are your findings? H0: 1) - Select your answer - v H... ,, p-value: (to 4 decimals) We that bearish sentiment is greater than its longterm average of 0.31. c. Would you feel comfortable extending these results to all investors? Why or why not? I. No. One should not feel comfortable extending these results to all investors. Members of this professional association may be different from other types of investors. Therefore, it would be dangerous to generalize these results to all investors. II. No. One should not feel comfortable extending these results to all investors. All investors must be a member of this professional association. Therefore, it is dangerous to generalize these results to all investors. 111. Yes. One should feel comfortable extending these results to all investors. The association contains investors. Therefore, it is ne to generalize these results to J - Select your answer - l comfortable extending these results to all investors. Members of this professional association may be different from other types \" it is fine to generalize these results to all investors. \"I IV on. - Select your answer - V
Step by Step Solution
There are 3 Steps involved in it

Get step-by-step solutions from verified subject matter experts