

Question: please please ans full pleaseeee 11. Real-Time Data Analysis Exercise Click the following link to view GDP/GNP data from FRED . Then use that data
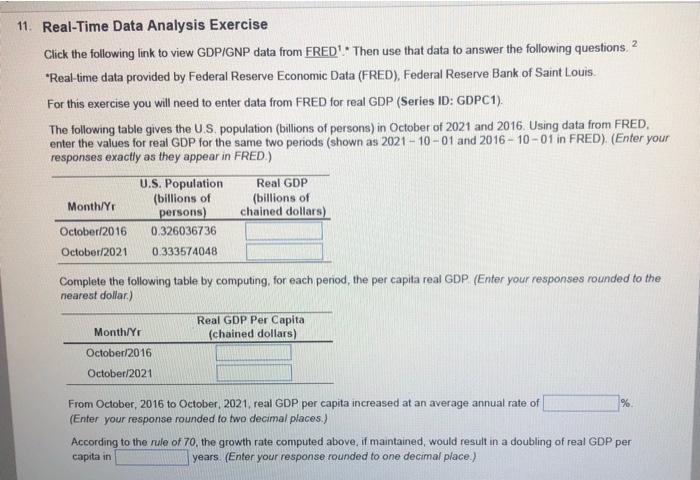
11. Real-Time Data Analysis Exercise Click the following link to view GDP/GNP data from FRED . Then use that data to answer the following questions, 2 "Real-time data provided by Federal Reserve Economic Data (FRED), Federal Reserve Bank of Saint Louis For this exercise you will need to enter data from FRED for real GDP (Series ID: GDPC1). The following table gives the U.S. population (billions of persons) in October of 2021 and 2016. Using data from FRED, enter the values for real GDP for the same two periods (shown as 2021-10-01 and 2016-10-01 in FRED) (Enter your responses exactly as they appear in FRED.) U.S. Population (billions of persons) 0.326036736 0.333574048 Real GDP (billions of chained dollars) Month/Y October 2016 October/2021 Complete the following table by computing, for each period, the per capita real GDP (Enter your responses rounded to the nearest dollar) Real GDP Per Capita Month/Yr (chained dollars) October 2016 October/2021 From October, 2016 to October, 2021, real GDP per capita increased at an average annual rate of % (Enter your response rounded to two decimal places.) According to the rule of 70, the growth rate computed above, if maintained, would result in a doubling of real GDP per capita in years. (Enter your response rounded to one decimal place.)
Step by Step Solution
There are 3 Steps involved in it

Get step-by-step solutions from verified subject matter experts