

Question: Please Please help if you know how to use Minitab/can do the problem. I can send Venmo or whatever if needed. I really need this
Please Please help if you know how to use Minitab/can do the problem. I can send Venmo or whatever if needed. I really need this for my grade.
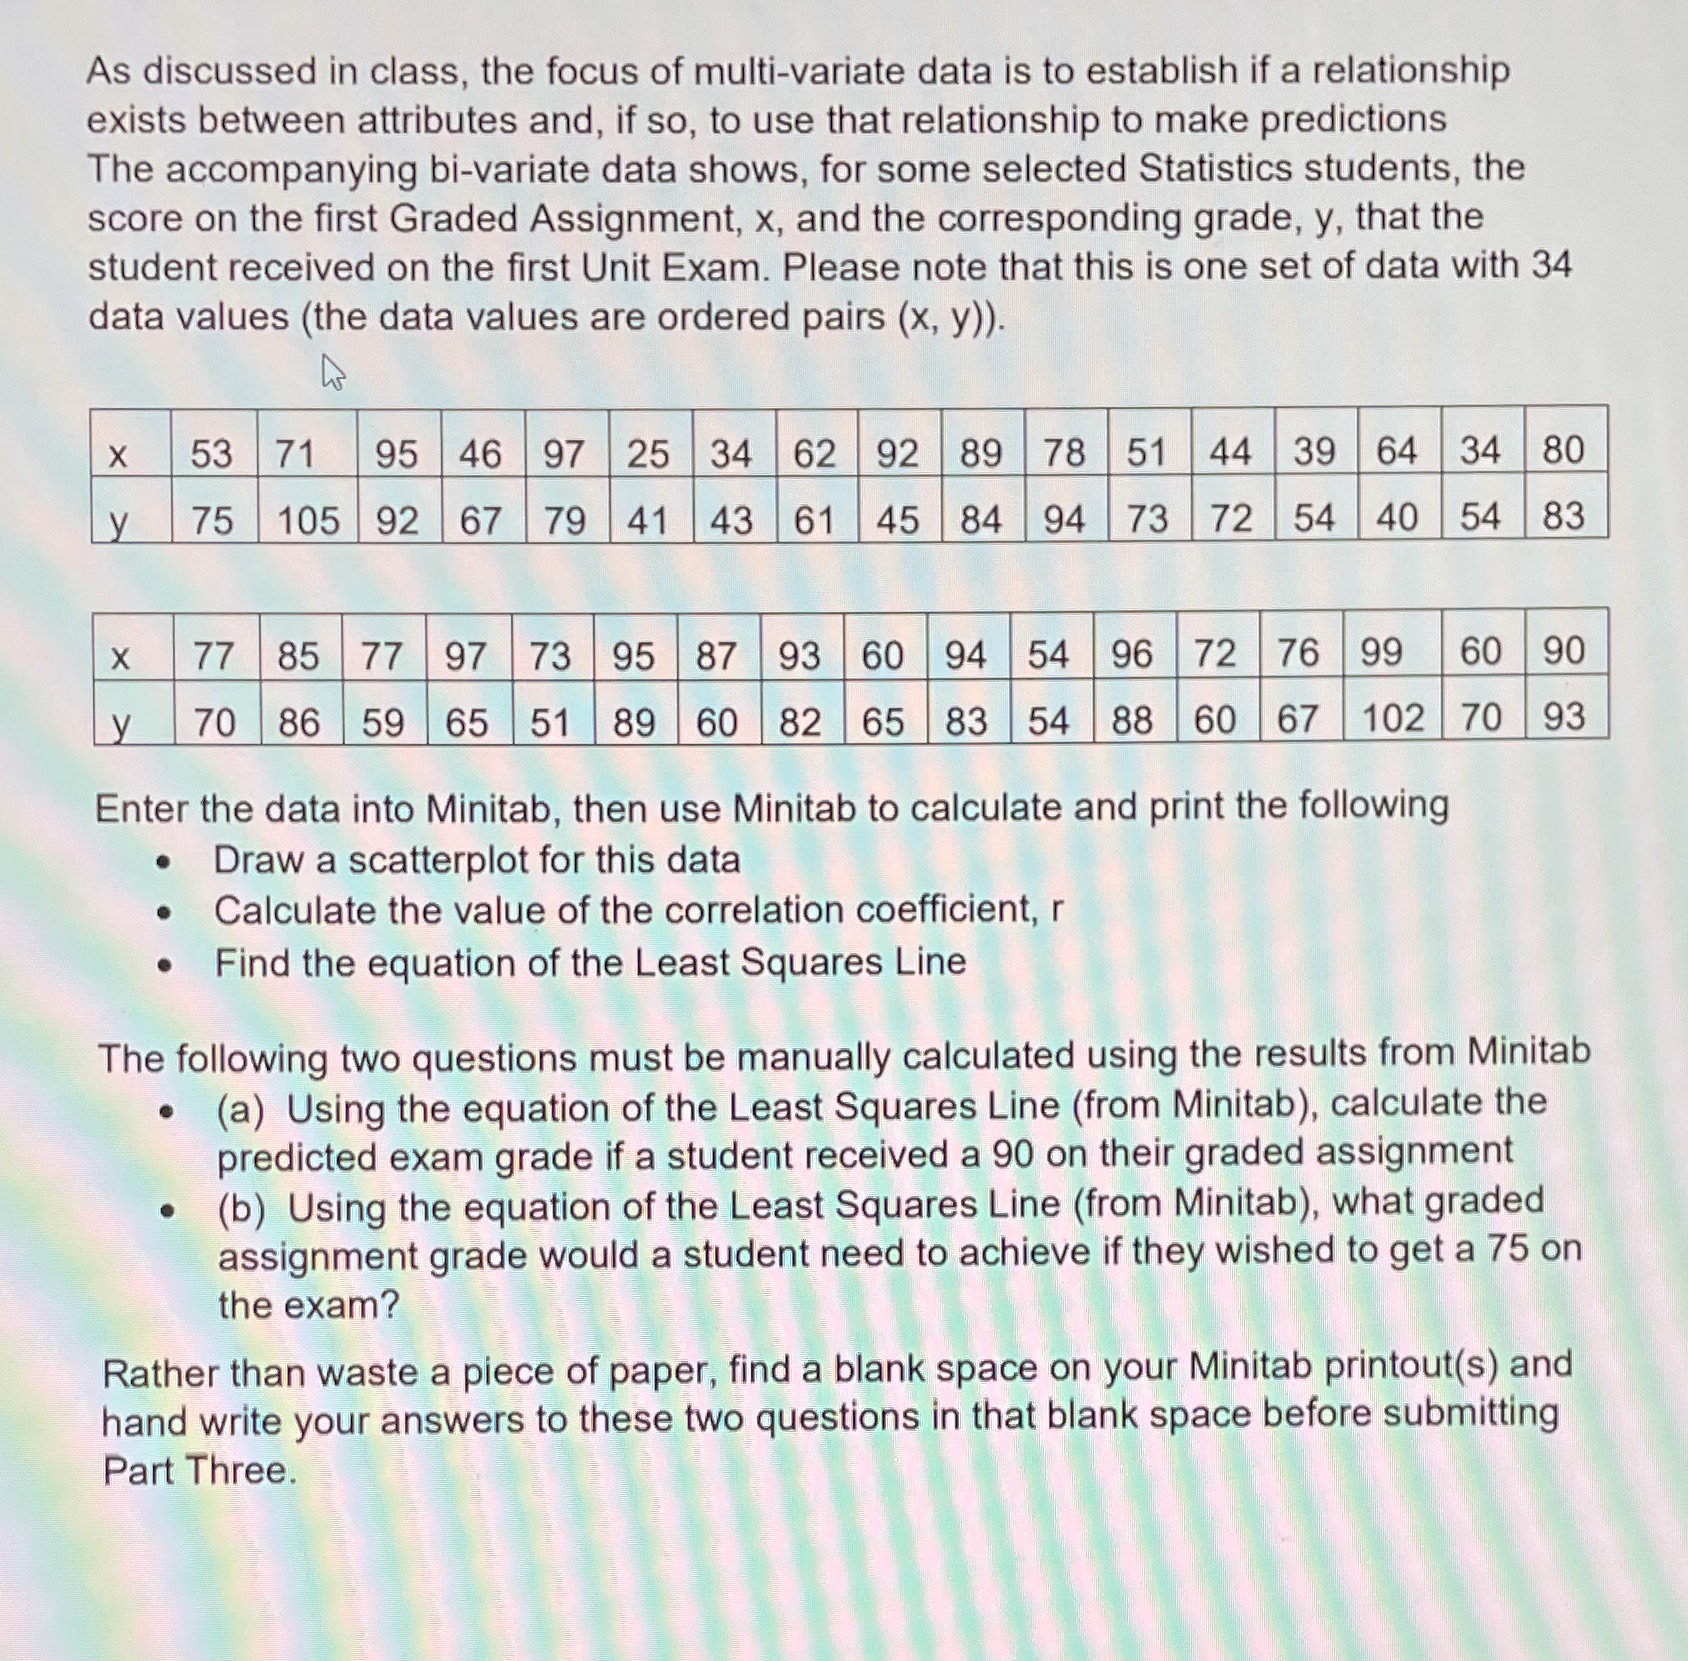
As discussed in class, the focus of multi-variate data is to establish if a relationship exists between attributes and, if so, to use that relationship to make predictions The accompanying bi-variate data shows, for some selected Statistics students, the score on the first Graded Assignment, x, and the corresponding grade, y, that the student received on the first Unit Exam. Please note that this is one set of data with 34 data values (the data values are ordered pairs (x, y)). X 53 71 95 46 97 25 34 62 92 89 78 51 44 39 64 34 80 V 75 105 92 67 79 41 43 61 45 84 94 73 72 54 40 54 83 X 77 85 77 97 73 95 87 93 60 94 54 96 72 76 99 60 90 V 70 86 59 65 51 89 60 82 65 83 54 88 60 67 102 70 93 Enter the data into Minitab, then use Minitab to calculate and print the following Draw a scatterplot for this data Calculate the value of the correlation coefficient, r . Find the equation of the Least Squares Line The following two questions must be manually calculated using the results from Minitab . (a) Using the equation of the Least Squares Line (from Minitab), calculate the predicted exam grade if a student received a 90 on their graded assignment (b) Using the equation of the Least Squares Line (from Minitab), what graded assignment grade would a student need to achieve if they wished to get a 75 on the exam? Rather than waste a piece of paper, find a blank space on your Minitab printout(s) and hand write your answers to these two questions in that blank space before submitting Part Three
Step by Step Solution
There are 3 Steps involved in it

Get step-by-step solutions from verified subject matter experts