

Question: please please help Using the financial statements for TransWorld Corp (in the separate Word file) and the following Ratios for last year and Industry Average
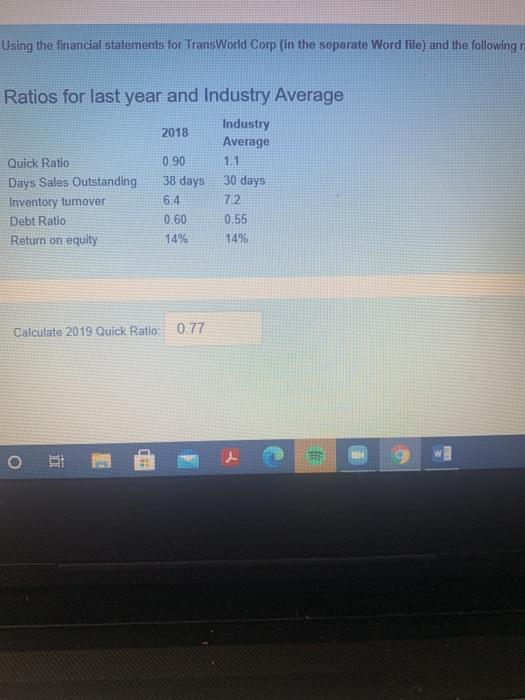
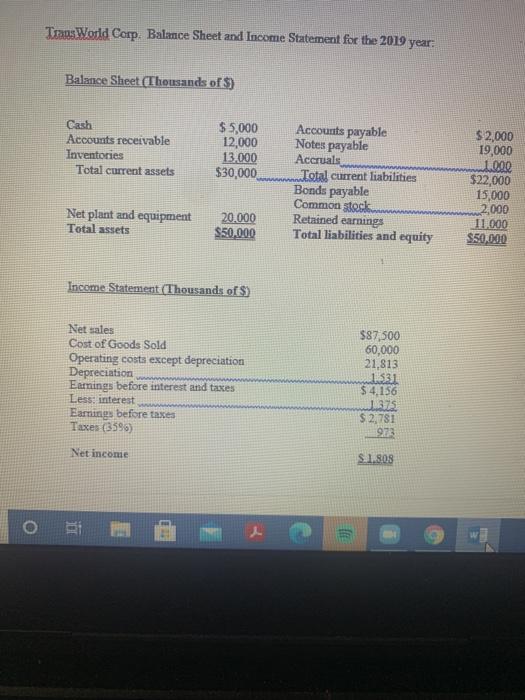
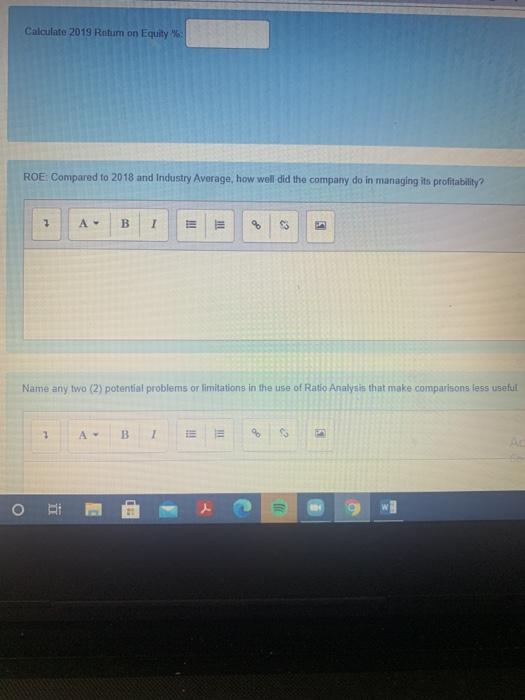
Using the financial statements for TransWorld Corp (in the separate Word file) and the following Ratios for last year and Industry Average Industry Average 2018 0.90 1.1 30 days Quick Ratio Days Sales Outstanding Inventory tumover Debt Ratio Return on equity 7.2 38 days 6.4 0.60 14% 0.55 14% Calculate 2019 Quick Ratio 0.77 o HO :))) TransWorld Corp. Balance Sheet and Income Statement for the 2019 year: Balance Sheet (Thousands of $) Cash Accounts receivable Inventories Total current assets $5,000 12,000 13.000 $30,000 Accounts payable Notes payable Accruals Total current liabilities Bonds payable Common stock Retained earnings Total liabilities and equity $2,000 19,000 1.000 $22,000 15,000 2,000 11.000 $50,000 Net plant and equipment Total assets 20.000 $50.000 Income Statement (Thousands of $) Net sales Cost of Goods Sold Operating costs except depreciation Depreciation Earnings before interest and taxes Less: interest Earnings before taxes Taxes (359) $87,500 60,000 21,813 1.531 $ 4,156 $ 2,781 92 Net income S 1.808 03 Calculate 2019 Rotum on Equity": ROE Compared to 2018 and Industry Average, how well did the company do in managing its profitability? 2 B 1 % Name any two (2) potential problems or limitations in the use of Ratio Analysis that make comparisons less useful 2 A- B 13 3) g vi
Step by Step Solution
There are 3 Steps involved in it

Get step-by-step solutions from verified subject matter experts