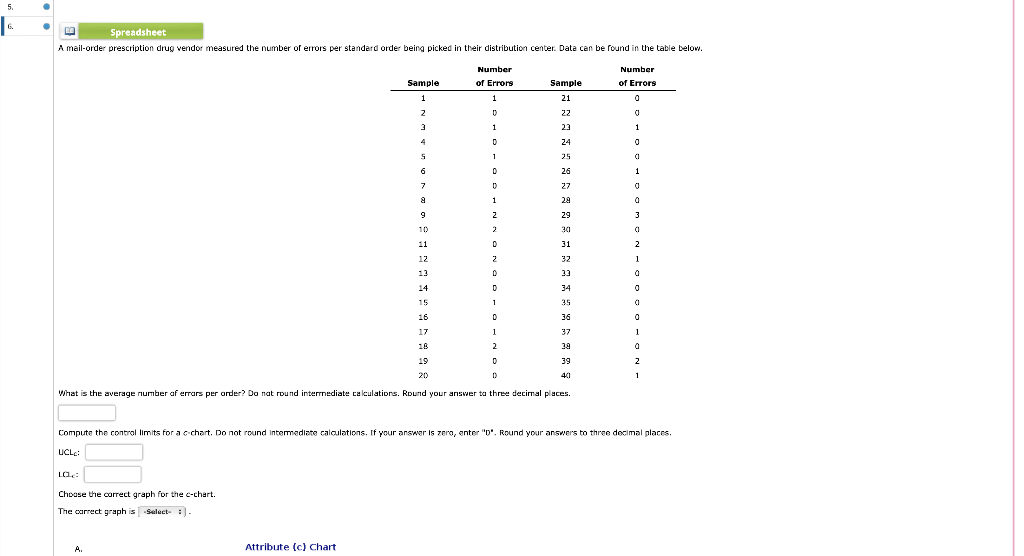
Question: PLEASE PLEASE ONLY PICK THIS QUESTION IF YOU CAN ACTUALLY SOLVE IT CORRECTLY, GETTING SO MANY WRONG ANSWERS. THANKS 5. 6. m Spreadsheet A mail-order

PLEASE PLEASE ONLY PICK THIS QUESTION IF YOU CAN ACTUALLY SOLVE IT CORRECTLY, GETTING SO MANY WRONG ANSWERS. THANKS

PLEASE PLEASE ONLY PICK THIS QUESTION IF YOU CAN

5. 6. m Spreadsheet A mail-order prescription drug vendor measured the number of errors per standard order being picked in their distribution center. Data can be found in the table below. Number Number Sample of Errors Sample of Errors 1 1 21 0 2 D 22 0 1 23 1 D 24 0 5 1 25 0 6 D 26 1 7 D 27 0 8 1 28 0 9 2 29 3 10 2 30 0 11 D 31 2 12 32 1 13 33 0 14 34 0 15 35 0 16 36 0 17 37 1 18 2 38 0 19 D 39 2 20 D 40 1 What is the average number of errors per order? Do nat round intermediate calculations. Round your answer to three decimal places. Compute the control limits for a c-chart. Do not round Intermediate calculations. If your answer is zero, enter "D". Round your answers to three decimal places. UCLE: LO: Choose the correct graph for the c-chart. The correct graph is -Select- : Attribute (c) Chart A. 2 D D 1 D 1

Step by Step Solution

There are 3 Steps involved in it

1 Expert Approved Answer
Step: 1 Unlock blur-text-image
Question Has Been Solved by an Expert!

Get step-by-step solutions from verified subject matter experts

Step: 2 Unlock
Step: 3 Unlock

Students Have Also Explored These Related General Management Questions!