

Question: please plot line graph for the said requirements. use any figures , I just need understanding how we gonna plot line graph for the items
please plot line graph for the said requirements. use any figures , I just need understanding how we gonna plot line graph for the items 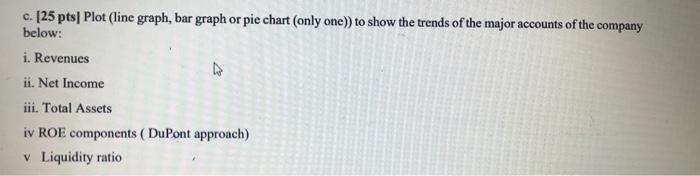
please assume data
c. [25 pts] Plot (line graph, bar graph or pie chart (only one)) to show the trends of the major accounts of the company below: i. Revenues ii. Net Income iii. Total Assets iv ROE components (DuPont approach) v Liquidity ratio c. [25 pts] Plot (line graph, bar graph or pie chart (only one)) to show the trends of the major accounts of the company below: i. Revenues ii. Net Income iii. Total Assets iv ROE components (DuPont approach) v Liquidity ratio
Step by Step Solution
There are 3 Steps involved in it
1 Expert Approved Answer
Step: 1 Unlock

Question Has Been Solved by an Expert!
Get step-by-step solutions from verified subject matter experts
Step: 2 Unlock
Step: 3 Unlock