

Question: please post chart in excel with formulas! Question 1: A manager wants to investigate a bottling process by using a sample mean chart. He knows
please post chart in excel with formulas! 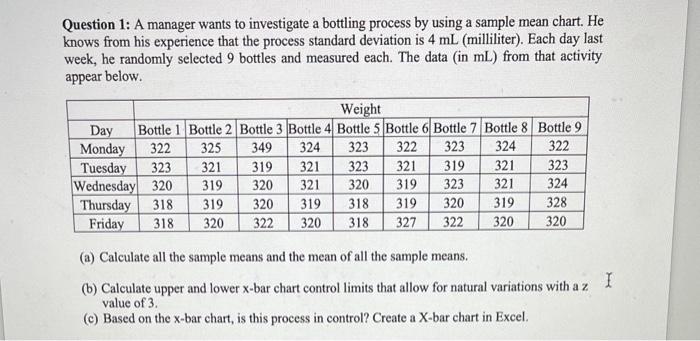
Question 1: A manager wants to investigate a bottling process by using a sample mean chart. He knows from his experience that the process standard deviation is 4mL (milliliter). Each day last week, he randomly selected 9 bottles and measured each. The data (in mL ) from that activity appear below. (a) Calculate all the sample means and the mean of all the sample means. (b) Calculate upper and lower x-bar chart control limits that allow for natural variations with a z value of 3 . (c) Based on the x-bar chart, is this process in control? Create a X-bar chart in Excel
Step by Step Solution
There are 3 Steps involved in it
1 Expert Approved Answer
Step: 1 Unlock

Question Has Been Solved by an Expert!
Get step-by-step solutions from verified subject matter experts
Step: 2 Unlock
Step: 3 Unlock