

Question: please post excel formulas Undo Clipboard M30 X fx =(M26* D E 13 14 15 16 17 18 19 20 21 22 23 24 25
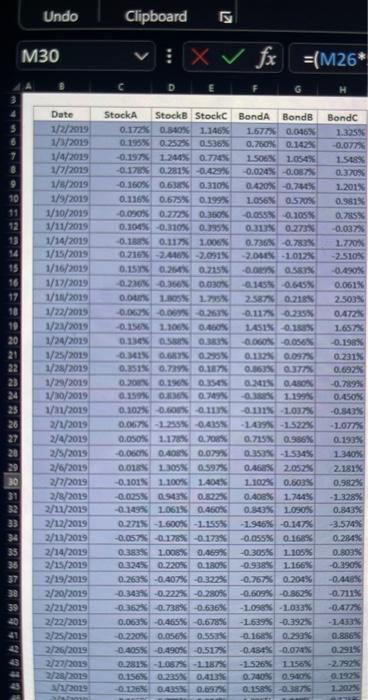
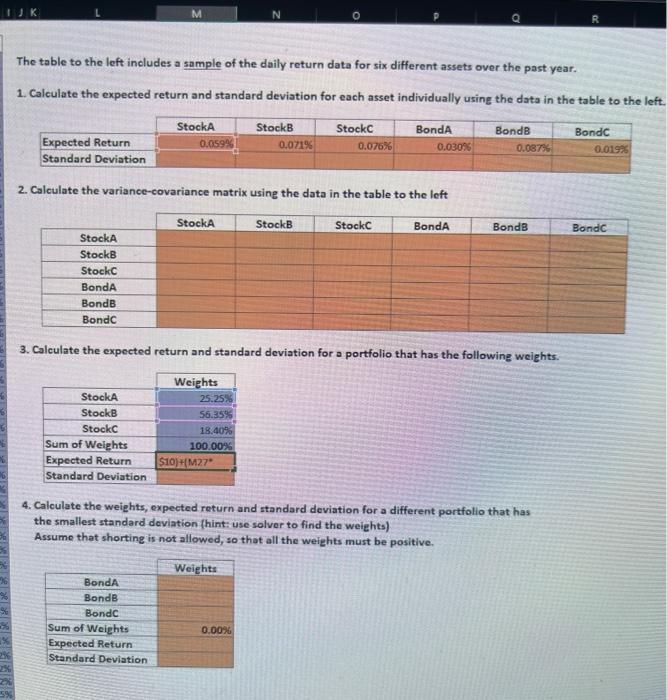
Undo Clipboard M30 X fx =(M26* D E 13 14 15 16 17 18 19 20 21 22 23 24 25 26 Date 1/2/2019 1/1/2019 1/4/2015 1/7/2019 1/1/2019 1/9/2019 1/10/2019 1/11/2019 1/14/2019 1/15/2019 1/16/2019 1/17/2019 1/11/2019 1/22/2019 1/28/2019 1/24/2029 1/25/2019 1/28/2019 1/28/2019 1/10/2019 1/21/2019 2/1/2018 2/4/2013 2/5/2015 2/6/2015 2/7/2019 2/8/2019 2/11/2019 2/12/2015 2/13/2013 2/14/2015 2/15/2019 2/19/2019 2/20/2019 2/21/2015 2/22/2019 2/25/2015 2./26/2019 2/27/2015 2/28/2019 W 2029 StockA Stock Stock BondA Bond 0.177% OSA 1.146% 1677X0.046% 0.195% 0.25% 0.53% 0.750 0.14% -0.197% 1.2% 0.77% SO 1054% -0.17 0.281% -0.42936 -0.024% -0.057% -0.160% 0.6 0.310 0.420% -0,75 0.116 0.675% 0.1997 1056 0.5205 0.0 0.272 0.10 0.05 0.105% 0.100% -0,31% 0.25% 0.313 0.273 0.1 0.117% 100 0.736 0.783 0.710 -2.4 -2.091 2.0 - 1.012% 0.15 0.2 0.715 00:58 0.0 0.0 0.030N 0.1455 -0,60% 0.0 1.0 L 2587 0.2185 0.0 0.0 0.2% -0.117% 0.25% 0.150 100 0.0 LASIK 0.133 0.130 ON ON GOGON -0.056 0.313 0.6 0.25% 0.112 0.8515 0.72 17 0.35 UT ON LINDSEN 0.25 0.450 0.15 0.79 1.1988 0.102.com 0113 -1 -1.037 0.067 -1.25% 0.25% -14-1522 0.00% 1.178% 70% 0.75 0.986 0.0 0.4056 0.07% 5% -1.534% 0.018 130 0.597% 0.4636 2,0525 -0.101% 1. 100% LADEN 1108 0.60 -0.025% 0.943% 82% 0.408% 17455 -0.1435 1061% 0.460 0.343% 1.090% 0.2725 -1.600% -1.155% -1.946% -0.147% -0.057 -0.178% -0.173 -0.05555 0.1638 0383 1.005% 0.469% -0.30556 1105% 0.220560.180X -0.9388 1166% 0.2635 -0.407% -0.3228 -0.767% 0.200% -0.343% -0.722% -0.280% -0.50 -05625 -0.3625, 0.7383 -0.636% -1.03% -1.033% 0.063% -0.465% -0.678% 15395 -0.392 -0.220% 0.056% 0.55 -0.16 0.29% -0.405% -0.4905 -0.517 -0.44% -0.07 0.281% -1.08% -1187% -1.5265 1156 0.156% 0.235% 0.413 0.74085 0.900 -0.265 0.435% 0.65 0.158% -0.387 Bond 1.33596 -0.07 1.518 0.3708 1.2018 0.981% 0.75 0.037) 1720 -2.510 0.490% 0.061% 2.500N 0.47 1657 0.19% 0.231% 0.692 -0.789% 0.450% -0.54215 - 1.077% 0.1935 1.340% 2181% 0.9825 -1328% 0.843% -3.5743 0.284% 0.8035 -0.890% -0.00 -0.711 -ATX -1.4333 0.856% 0.29155 20 30 31 32 33 35 36 37 38 39 IK M N R The table to the left includes a sample of the daily return data for six different assets over the past year. 1. Calculate the expected return and standard deviation for each asset individually using the data in the table to the left. StockA 0.05996 Expected Return Standard Deviation StockB 0.071% Stock 0.076% Bonda 0.030% BondB 0.08754 Bondc 0.01926 2. Calculate the variance-covariance matrix using the data in the table to the left StockA StockB Stock BondA BondB Bond StockA StockB Stock Bonda BondB Bondc 3. Calculate the expected return and standard deviation for a portfolio that has the following weights. StockA StockB Stock Sum of Weights Expected Return Standard Deviation Weights 25.25% 56.35% 18.40% 100.00% $10)#M27" 6 4. Calculate the weights, expected return and standard deviation for a different portfolio that has the smallest standard deviation (hint: use solver to find the weights) Assume that shorting is not allowed, so that all the weights must be positive. Weights Bonda Bonde Bondc Sum of Weights Expected Return Standard Deviation 0.00% 59
Step by Step Solution
There are 3 Steps involved in it

Get step-by-step solutions from verified subject matter experts