

Question: Please post formulas if there are any, there is more excel entries, I will just modify the formula to fit the rest. Thank you! 2.


Please post formulas if there are any, there is more excel entries, I will just modify the formula to fit the rest. Thank you!
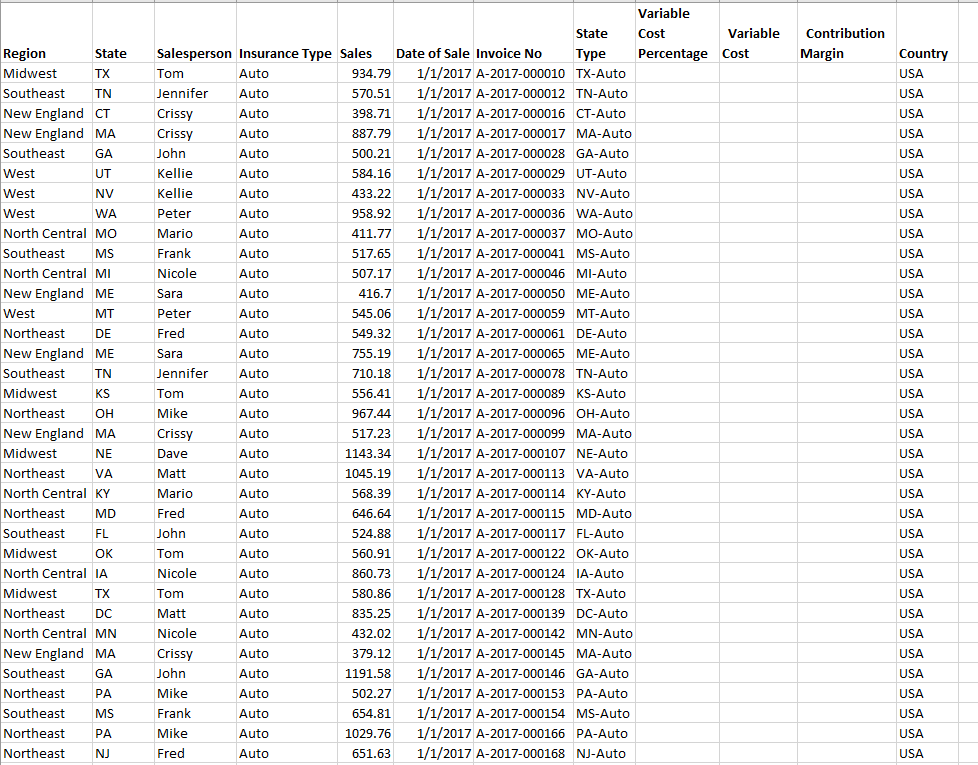
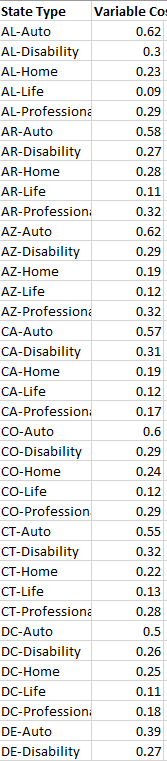
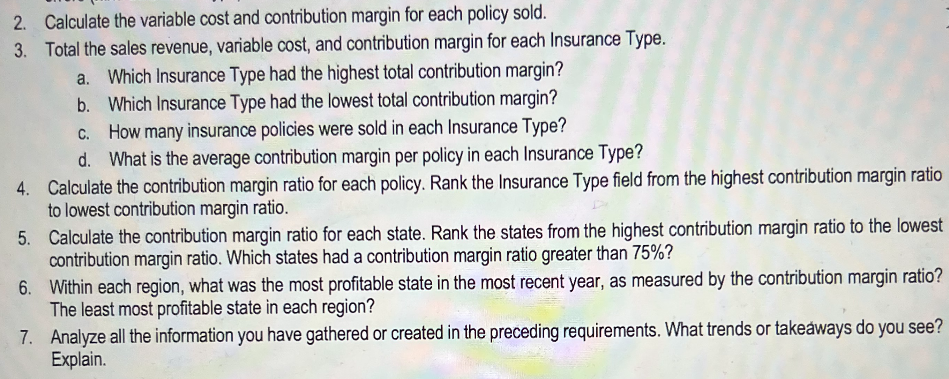
2. Calculate the variable cost and contribution margin for each policy sold. 3. Total the sales revenue, variable cost, and contribution margin for each Insurance Type. a. Which Insurance Type had the highest total contribution margin? b. Which Insurance Type had the lowest total contribution margin? c. How many insurance policies were sold in each Insurance Type? d. What is the average contribution margin per policy in each Insurance Type? 4. Calculate the contribution margin ratio for each policy. Rank the Insurance Type field from the highest contribution margin ratio to lowest contribution margin ratio. 5. Calculate the contribution margin ratio for each state. Rank the states from the highest contribution margin ratio to the lowest contribution margin ratio. Which states had a contribution margin ratio greater than 75%? 6. Within each region, what was the most profitable state in the most recent year, as measured by the contribution margin ratio? The least most profitable state in each region? 7. Analyze all the information you have gathered or created in the preceding requirements. What trends or takeaways do you see? Explain. Contribution Margin Tom Country USA USA USA USA USA USA USA USA USA USA USA USA USA USA USA Region State Midwest TX Southeast TN New England CT New England MA Southeast GA West UT West NV West WA North Central MO Southeast MS North Central MI New England ME West MT Northeast DE New England ME Southeast TN Midwest KS Northeast OH New England MA Midwest NE Northeast VA North Central KY Northeast MD Southeast FL Midwest OK North Central IA Midwest TX Northeast DC North Central MN New England MA Southeast GA Northeast PA Southeast MS Northeast PA Northeast NJ Variable State Cost Variable Salesperson Insurance Type Sales Date of Sale Invoice No Type Percentage Cost Auto 934.79 1/1/2017 A-2017-000010 TX-Auto Jennifer Auto 570.51 1/1/2017 A-2017-000012 TN-Auto Crissy Auto 398.71 1/1/2017 A-2017-000016 CT-Auto Crissy Auto 887.79 1/1/2017 A-2017-000017 MA-Auto John Auto 500.21 1/1/2017 A-2017-000028 GA-Auto Kellie Auto 584.16 1/1/2017 A-2017-000029 UT-Auto Kellie Auto 433.22 1/1/2017 A-2017-000033 NV-Auto Peter Auto 958.92 1/1/2017 A-2017-000036 WA-Auto Mario Auto 411.77 1/1/2017 A-2017-000037 MO-Auto Frank Auto 517.65 1/1/2017 A-2017-000041 MS-Auto Nicole Auto 507.17 1/1/2017 A-2017-000046 MI-Auto Sara Auto 416.7 1/1/2017 A-2017-000050 ME-Auto Peter Auto 545.06 1/1/2017 A-2017-000059 MT-Auto Fred Auto 549.32 1/1/2017 A-2017-000061 DE-Auto Sara Auto 755.19 1/1/2017 A-2017-000065 ME-Auto Jennifer Auto 710.18 1/1/2017 A-2017-000078 TN-Auto Auto 556.41 1/1/2017 A-2017-000089 KS-Auto Mike Auto 967.44 1/1/2017 A-2017-000096 OH-Auto Crissy Auto 517.23 1/1/2017 A-2017-000099 MA-Auto Dave Auto 1143.34 1/1/2017 A-2017-000107 NE-Auto Matt Auto 1045.19 1/1/2017 A-2017-000113 VA-Auto Mario Auto 568.39 1/1/2017 A-2017-000114 KY-Auto Fred Auto 646.64 1/1/2017 A-2017-000115 MD-Auto John Auto 524.88 1/1/2017 A-2017-000117 FL-Auto Tom Auto 560.91 1/1/2017 A-2017-000122 OK-Auto Nicole Auto 860.73 1/1/2017 A-2017-000124 IA-Auto Tom Auto 580.86 1/1/2017 A-2017-000128 TX-Auto Matt Auto 835.25 1/1/2017 A-2017-000139 DC-Auto Nicole Auto 432.02 1/1/2017 A-2017-000142 MN-Auto Crissy Auto 379.12 1/1/2017 A-2017-000145 MA-Auto John Auto 1191.58 1/1/2017 A-2017-000146 GA-Auto Mike Auto 502.27 1/1/2017 A-2017-000153 PA-Auto Frank Auto 654.81 1/1/2017 A-2017-000154 MS-Auto Mike Auto 1029.76 1/1/2017 A-2017-000166 PA-Auto Fred Auto 651.63 1/1/2017 A-2017-000168 NJ-Auto Tom USA USA USA USA USA USA USA USA USA USA USA USA USA USA USA USA USA USA USA USA State Type AL-Auto AL-Disability AL-Home AL-Life AL-Professiona AR-Auto AR-Disability AR-Home AR-Life AR-Profession AZ-Auto AZ-Disability AZ-Home AZ-Life AZ-Professiona CA-Auto CA-Disability CA-Home CA-Life CA-Profession; CO-Auto CO-Disability CO-Home CO-Life CO-Profession CT-Auto CT-Disability CT-Home CT-Life CT-Professiona DC-Auto DC-Disability DC-Home DC-Life DC-Profession: DE-Auto DE-Disability Variable Cos 0.62 0.3 0.23 0.09 0.29 0.58 0.27 0.28 0.11 0.32 0.62 0.29 0.19 0.12 0.32 0.57 0.31 0.19 0.12 0.17 0.6 0.29 0.24 0.12 0.29 0.55 0.32 0.22 0.13 0.28 0.5 0.26 0.25 0.11 0.18 0.39 0.27 2. Calculate the variable cost and contribution margin for each policy sold. 3. Total the sales revenue, variable cost, and contribution margin for each Insurance Type. a. Which Insurance Type had the highest total contribution margin? b. Which Insurance Type had the lowest total contribution margin? c. How many insurance policies were sold in each Insurance Type? d. What is the average contribution margin per policy in each Insurance Type? 4. Calculate the contribution margin ratio for each policy. Rank the Insurance Type field from the highest contribution margin ratio to lowest contribution margin ratio. 5. Calculate the contribution margin ratio for each state. Rank the states from the highest contribution margin ratio to the lowest contribution margin ratio. Which states had a contribution margin ratio greater than 75%? 6. Within each region, what was the most profitable state in the most recent year, as measured by the contribution margin ratio? The least most profitable state in each region? 7. Analyze all the information you have gathered or created in the preceding requirements. What trends or takeaways do you see? Explain. Contribution Margin Tom Country USA USA USA USA USA USA USA USA USA USA USA USA USA USA USA Region State Midwest TX Southeast TN New England CT New England MA Southeast GA West UT West NV West WA North Central MO Southeast MS North Central MI New England ME West MT Northeast DE New England ME Southeast TN Midwest KS Northeast OH New England MA Midwest NE Northeast VA North Central KY Northeast MD Southeast FL Midwest OK North Central IA Midwest TX Northeast DC North Central MN New England MA Southeast GA Northeast PA Southeast MS Northeast PA Northeast NJ Variable State Cost Variable Salesperson Insurance Type Sales Date of Sale Invoice No Type Percentage Cost Auto 934.79 1/1/2017 A-2017-000010 TX-Auto Jennifer Auto 570.51 1/1/2017 A-2017-000012 TN-Auto Crissy Auto 398.71 1/1/2017 A-2017-000016 CT-Auto Crissy Auto 887.79 1/1/2017 A-2017-000017 MA-Auto John Auto 500.21 1/1/2017 A-2017-000028 GA-Auto Kellie Auto 584.16 1/1/2017 A-2017-000029 UT-Auto Kellie Auto 433.22 1/1/2017 A-2017-000033 NV-Auto Peter Auto 958.92 1/1/2017 A-2017-000036 WA-Auto Mario Auto 411.77 1/1/2017 A-2017-000037 MO-Auto Frank Auto 517.65 1/1/2017 A-2017-000041 MS-Auto Nicole Auto 507.17 1/1/2017 A-2017-000046 MI-Auto Sara Auto 416.7 1/1/2017 A-2017-000050 ME-Auto Peter Auto 545.06 1/1/2017 A-2017-000059 MT-Auto Fred Auto 549.32 1/1/2017 A-2017-000061 DE-Auto Sara Auto 755.19 1/1/2017 A-2017-000065 ME-Auto Jennifer Auto 710.18 1/1/2017 A-2017-000078 TN-Auto Auto 556.41 1/1/2017 A-2017-000089 KS-Auto Mike Auto 967.44 1/1/2017 A-2017-000096 OH-Auto Crissy Auto 517.23 1/1/2017 A-2017-000099 MA-Auto Dave Auto 1143.34 1/1/2017 A-2017-000107 NE-Auto Matt Auto 1045.19 1/1/2017 A-2017-000113 VA-Auto Mario Auto 568.39 1/1/2017 A-2017-000114 KY-Auto Fred Auto 646.64 1/1/2017 A-2017-000115 MD-Auto John Auto 524.88 1/1/2017 A-2017-000117 FL-Auto Tom Auto 560.91 1/1/2017 A-2017-000122 OK-Auto Nicole Auto 860.73 1/1/2017 A-2017-000124 IA-Auto Tom Auto 580.86 1/1/2017 A-2017-000128 TX-Auto Matt Auto 835.25 1/1/2017 A-2017-000139 DC-Auto Nicole Auto 432.02 1/1/2017 A-2017-000142 MN-Auto Crissy Auto 379.12 1/1/2017 A-2017-000145 MA-Auto John Auto 1191.58 1/1/2017 A-2017-000146 GA-Auto Mike Auto 502.27 1/1/2017 A-2017-000153 PA-Auto Frank Auto 654.81 1/1/2017 A-2017-000154 MS-Auto Mike Auto 1029.76 1/1/2017 A-2017-000166 PA-Auto Fred Auto 651.63 1/1/2017 A-2017-000168 NJ-Auto Tom USA USA USA USA USA USA USA USA USA USA USA USA USA USA USA USA USA USA USA USA State Type AL-Auto AL-Disability AL-Home AL-Life AL-Professiona AR-Auto AR-Disability AR-Home AR-Life AR-Profession AZ-Auto AZ-Disability AZ-Home AZ-Life AZ-Professiona CA-Auto CA-Disability CA-Home CA-Life CA-Profession; CO-Auto CO-Disability CO-Home CO-Life CO-Profession CT-Auto CT-Disability CT-Home CT-Life CT-Professiona DC-Auto DC-Disability DC-Home DC-Life DC-Profession: DE-Auto DE-Disability Variable Cos 0.62 0.3 0.23 0.09 0.29 0.58 0.27 0.28 0.11 0.32 0.62 0.29 0.19 0.12 0.32 0.57 0.31 0.19 0.12 0.17 0.6 0.29 0.24 0.12 0.29 0.55 0.32 0.22 0.13 0.28 0.5 0.26 0.25 0.11 0.18 0.39 0.27
Step by Step Solution
There are 3 Steps involved in it

Get step-by-step solutions from verified subject matter experts