

Question: Please post google sheet link when completed! B D E F G . U K A Boeing Kellogg 1 BA K 2 Average 10.75% 6.28%
 Please post google sheet link when completed!
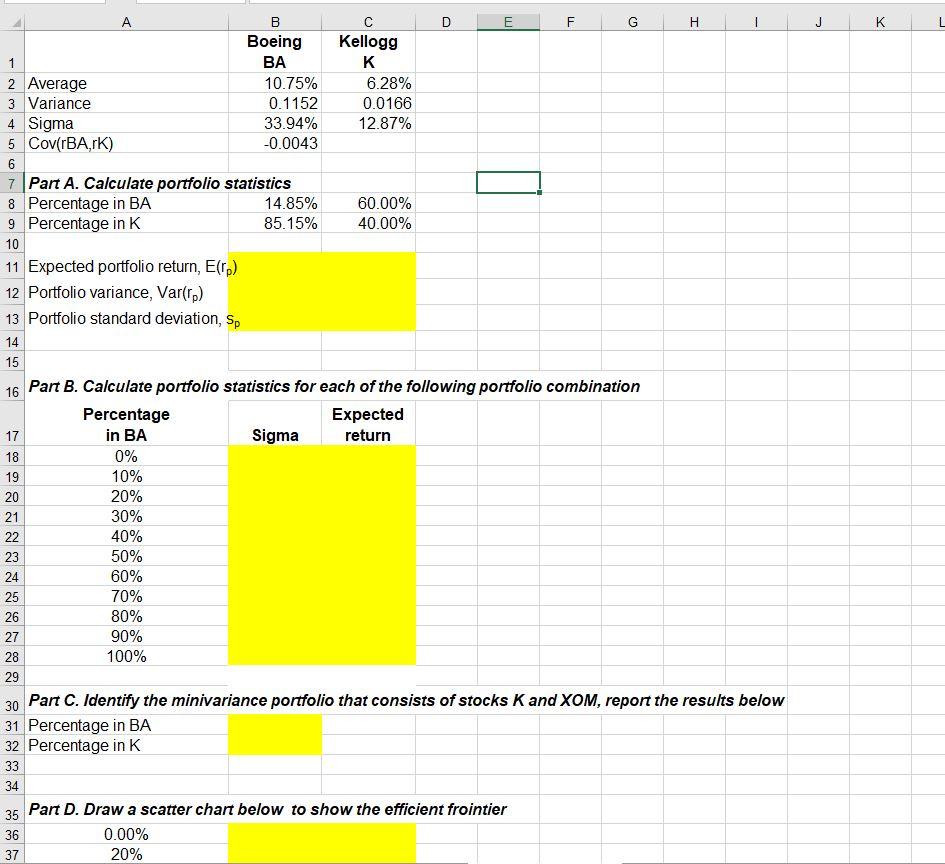
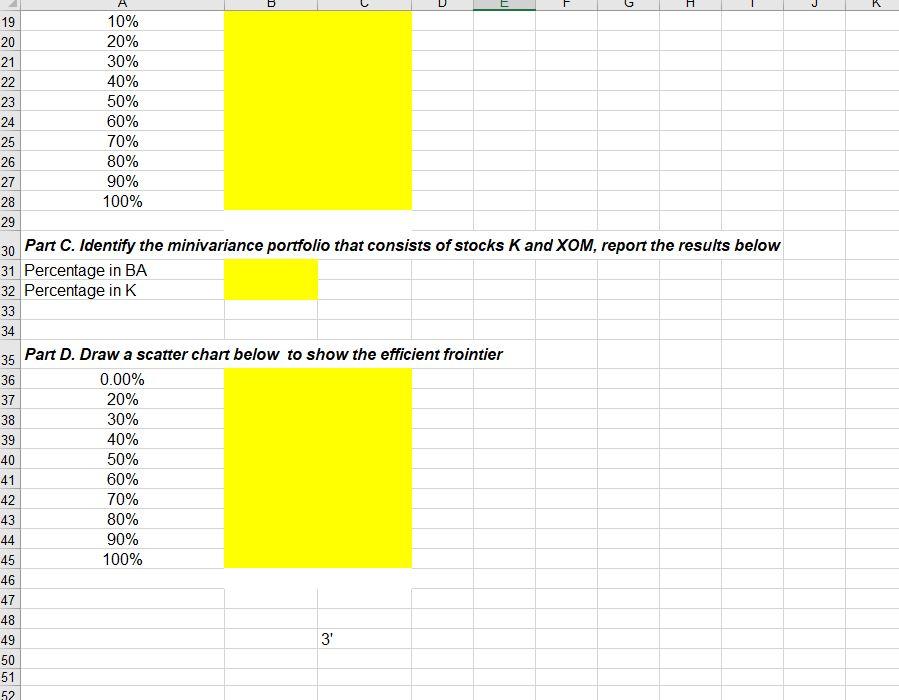
B D E F G . U K A Boeing Kellogg 1 BA K 2 Average 10.75% 6.28% 3 Variance 0.1152 0.0166 4 Sigma 33.94% 12.87% 5 Cov(rBA,TK) -0.0043 6 7 Part A. Calculate portfolio statistics 8 Percentage in BA 14.85% 60.00% 9 Percentage in K 85.15% 40.00% 10 11 Expected portfolio return, E(Tp) 12 Portfolio variance, Var(rp) 13 Portfolio standard deviation, Sp 14 15 16 Part B. Calculate portfolio statistics for each of the following portfolio combination Percentage Expected 17 in BA Sigma return 18 0% 19 10% 20 20% 21 30% 22 40% 23 50% 24 60% 25 70% 26 80% 27 90% 28 100% 29 30 Part C. Identify the minivariance portfolio that consists of stocks K and XOM, report the results below 31 Percentage in BA 32 Percentage in K 33 34 35 Part D. Draw a scatter chart below to show the efficient frointier 36 0.00% 37 20% B D IM L G H K 19 10% 20 20% 21 30% 22 40% 23 50% 24 60% 25 70% 26 80% 27 90% 28 100% 29 30 Part C. Identify the minivariance portfolio that consists of stocks K and XOM, report the results below 31 Percentage in BA 32 Percentage in K 33 34 35 Part D. Draw a scatter chart below to show the efficient frointier 36 0.00% 37 20% 38 30% 39 40% 40 50% 60% 42 70% 43 80% 44 90% 45 100% 46 41 47 3' 48 49 50 51 52 B D E F G . U K A Boeing Kellogg 1 BA K 2 Average 10.75% 6.28% 3 Variance 0.1152 0.0166 4 Sigma 33.94% 12.87% 5 Cov(rBA,TK) -0.0043 6 7 Part A. Calculate portfolio statistics 8 Percentage in BA 14.85% 60.00% 9 Percentage in K 85.15% 40.00% 10 11 Expected portfolio return, E(Tp) 12 Portfolio variance, Var(rp) 13 Portfolio standard deviation, Sp 14 15 16 Part B. Calculate portfolio statistics for each of the following portfolio combination Percentage Expected 17 in BA Sigma return 18 0% 19 10% 20 20% 21 30% 22 40% 23 50% 24 60% 25 70% 26 80% 27 90% 28 100% 29 30 Part C. Identify the minivariance portfolio that consists of stocks K and XOM, report the results below 31 Percentage in BA 32 Percentage in K 33 34 35 Part D. Draw a scatter chart below to show the efficient frointier 36 0.00% 37 20% B D IM L G H K 19 10% 20 20% 21 30% 22 40% 23 50% 24 60% 25 70% 26 80% 27 90% 28 100% 29 30 Part C. Identify the minivariance portfolio that consists of stocks K and XOM, report the results below 31 Percentage in BA 32 Percentage in K 33 34 35 Part D. Draw a scatter chart below to show the efficient frointier 36 0.00% 37 20% 38 30% 39 40% 40 50% 60% 42 70% 43 80% 44 90% 45 100% 46 41 47 3' 48 49 50 51 52
Step by Step Solution
There are 3 Steps involved in it

Get step-by-step solutions from verified subject matter experts