

Question: Please post pictures of excel Using EXCEL Descriptive statistics (using Excel data analysis tool) Generally one of the first things to do with new data
 Please post pictures of excel
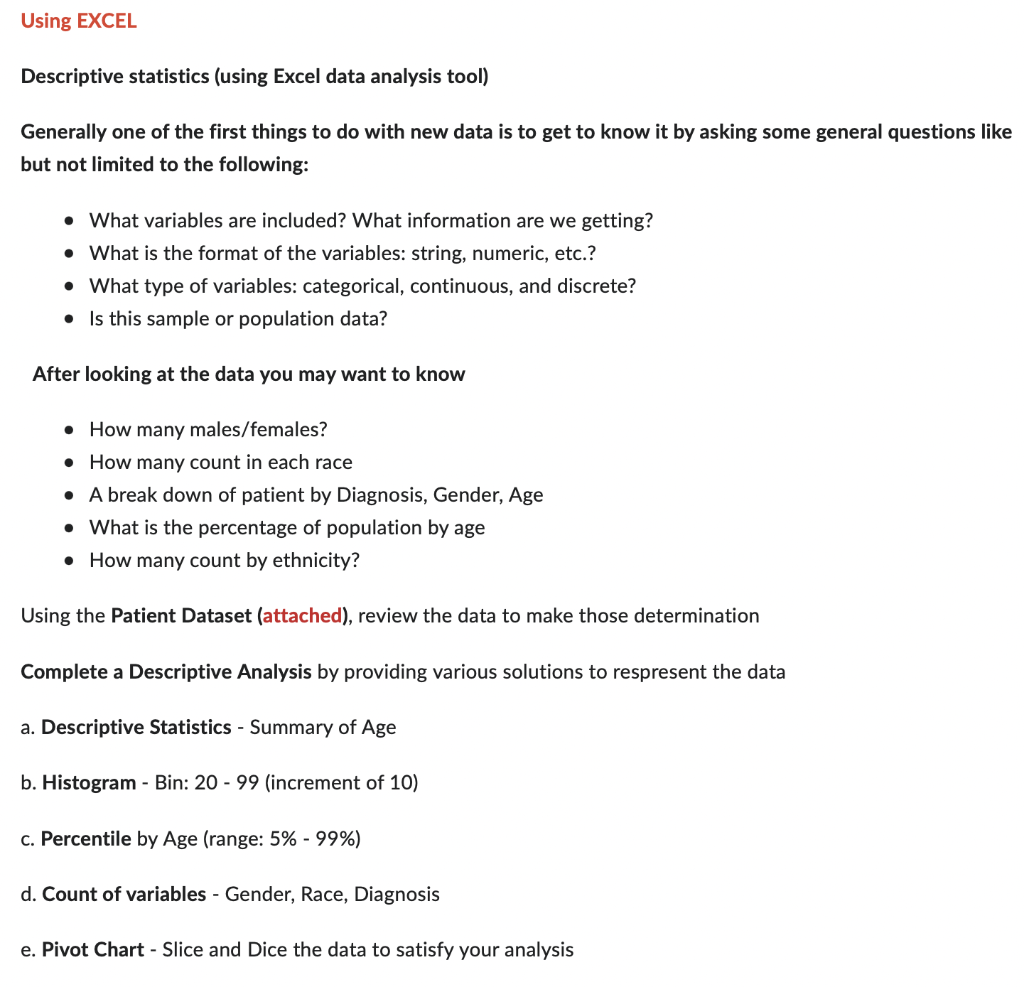
Using EXCEL Descriptive statistics (using Excel data analysis tool) Generally one of the first things to do with new data is to get to know it by asking some general questions like but not limited to the following: - What variables are included? What information are we getting? - What is the format of the variables: string, numeric, etc.? - What type of variables: categorical, continuous, and discrete? - Is this sample or population data? After looking at the data you may want to know - How many males/females? - How many count in each race - A break down of patient by Diagnosis, Gender, Age - What is the percentage of population by age - How many count by ethnicity? Using the Patient Dataset (attached), review the data to make those determination Complete a Descriptive Analysis by providing various solutions to respresent the data a. Descriptive Statistics - Summary of Age b. Histogram - Bin: 20 - 99 (increment of 10) c. Percentile by Age (range: 5%99% ) d. Count of variables - Gender, Race, Diagnosis e. Pivot Chart - Slice and Dice the data to satisfy your analysis
Step by Step Solution
There are 3 Steps involved in it

Get step-by-step solutions from verified subject matter experts