

Question: please post the excel sheet with formula!! Q3. Constructing an E-chart AND an R-chart At ABC Super Store, the customer service area processes customer returns,
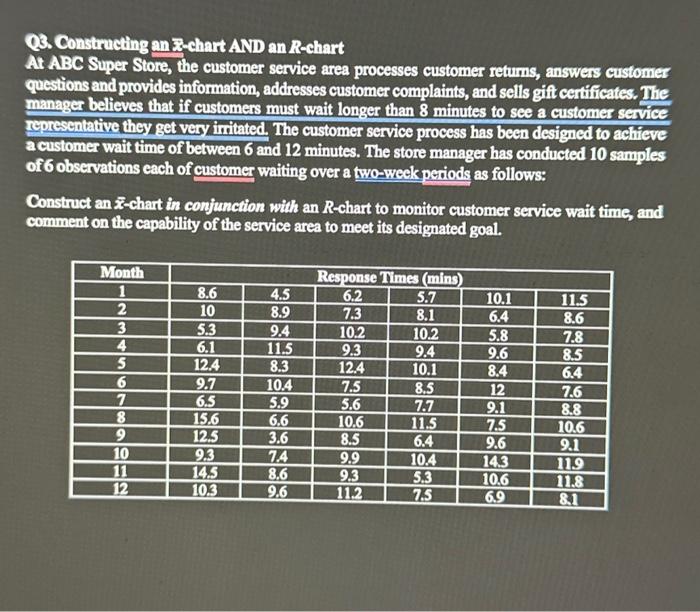
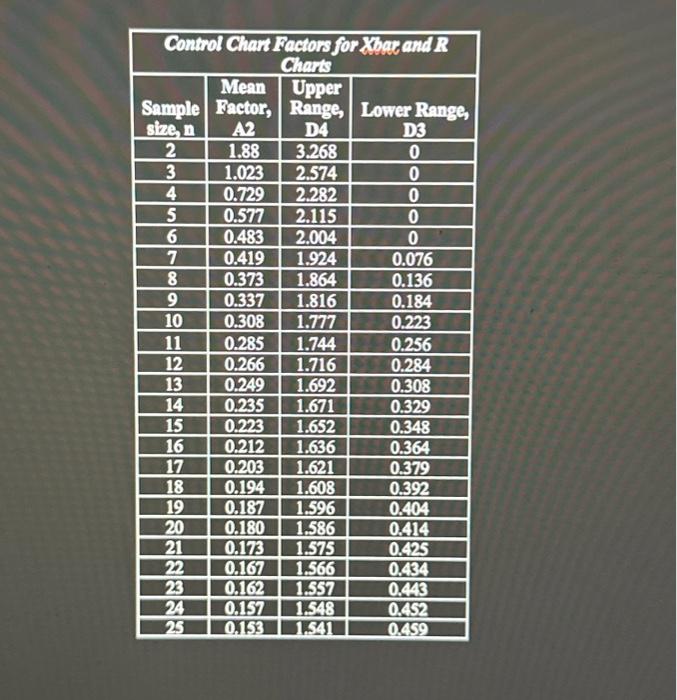
Q3. Constructing an E-chart AND an R-chart At ABC Super Store, the customer service area processes customer returns, answers customer questions and provides information, addresses customer complaints, and sells gift certificates. The manager believes that if customers must wait longer than 8 minutes to see a customer service representative they get very irititated. The customer service process has been designed to achieve a customer wait time of between 6 and 12 minutes. The store manager has conducted 10 samples of 6 observations each of customer waiting over a two-weck periods as follows: Construct an x-chart in conjunction with an R-chart to monitor customer service wait time, and comment on the capability of the service area to meet its designated goal. \begin{tabular}{|c|c|c|c|} \hline \multicolumn{4}{|c|}{ Control Chart Factors for Xbac and R } \\ \hline \begin{tabular}{c} Sample \\ sing, \end{tabular} & \begin{tabular}{c} Mean \\ Factor, \\ A2 \end{tabular} & \begin{tabular}{c} Upper \\ Range, \\ D4 \end{tabular} & \begin{tabular}{c} Lower Range, \\ D3 \end{tabular} \\ \hline 2 & 1.88 & 3.268 & 0 \\ \hline 3 & 1.023 & 2.574 & 0 \\ \hline 4 & 0.729 & 2.282 & 0 \\ \hline 5 & 0.577 & 2.115 & 0 \\ \hline 6 & 0.483 & 2.004 & 0 \\ \hline 7 & 0.419 & 1.924 & 0.076 \\ \hline 8 & 0.373 & 1.864 & 0.136 \\ \hline 9 & 0.337 & 1.816 & 0.184 \\ \hline 10 & 0.308 & 1.777 & 0.223 \\ \hline 11 & 0.285 & 1.744 & 0.256 \\ \hline 12 & 0.266 & 1.716 & 0.284 \\ \hline 13 & 0.249 & 1.692 & 0.308 \\ \hline 14 & 0.235 & 1.671 & 0.329 \\ \hline 15 & 0.223 & 1.652 & 0.348 \\ \hline 16 & 0.212 & 1.636 & 0.364 \\ \hline 17 & 0.203 & 1.621 & 0.379 \\ \hline 18 & 0.194 & 1.608 & 0.392 \\ \hline 19 & 0.187 & 1.596 & 0.404 \\ \hline 20 & 0.180 & 1.586 & 0.414 \\ \hline 21 & 0.173 & 1.575 & 0.425 \\ \hline 22 & 0.167 & 1.566 & 0.434 \\ \hline 23 & 0.162 & 1.557 & 0.443 \\ \hline 24 & 0.157 & 1.548 & 0.652 \\ \hline 25 & 0.153 & 1.541 & 0.559 \\ \hline \end{tabular}
Step by Step Solution
There are 3 Steps involved in it

Get step-by-step solutions from verified subject matter experts