

Question: Please post the R code as well. Thanks. Gamma distribution maximum likelihood estimation i) Generate one sample of size n = 100 of Gamma data
Please post the R code as well. Thanks.
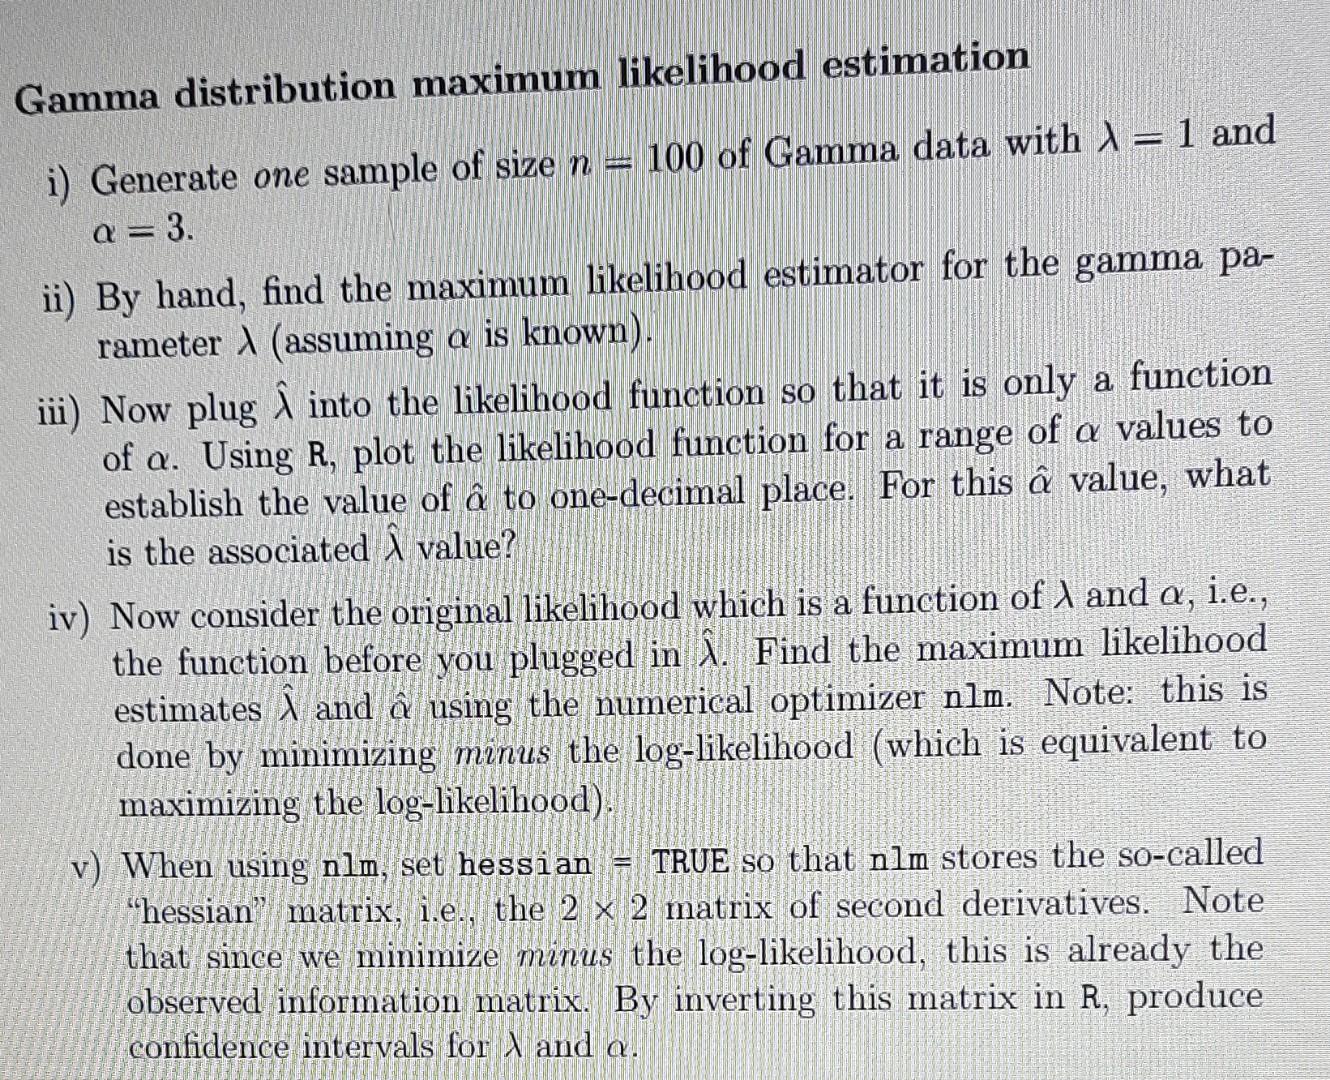
Gamma distribution maximum likelihood estimation i) Generate one sample of size n = 100 of Gamma data with \ = 1 and a = 3. ii) By hand, find the maximum likelihood estimator for the gamma pa- rameter (assuming a is known). iii) Now plug into the likelihood function so that it is only a function of a. Using R, plot the likelihood function for a range of a values to establish the value of to one-decimal place. For this value, what is the associated \ value? iv) Now consider the original likelihood which is a function of land a, i.e., the function before you plugged in \. Find the maximum likelihood estimates i and using the numerical optimizer nlm. Note: this is done by minimizing minus the log-likelihood (which is equivalent to maximizing the log-likelihood). v) When using nlm, set hessian TRUE so that nlm stores the so-called "hessian" matrix, i.e., the 2 x 2 matrix of second derivatives. Note that since we minimize minus the log-likelihood, this is already the observed information matrix. By inverting this matrix in R, produce confidence intervals for X and a. . Gamma distribution maximum likelihood estimation i) Generate one sample of size n = 100 of Gamma data with \ = 1 and a = 3. ii) By hand, find the maximum likelihood estimator for the gamma pa- rameter (assuming a is known). iii) Now plug into the likelihood function so that it is only a function of a. Using R, plot the likelihood function for a range of a values to establish the value of to one-decimal place. For this value, what is the associated \ value? iv) Now consider the original likelihood which is a function of land a, i.e., the function before you plugged in \. Find the maximum likelihood estimates i and using the numerical optimizer nlm. Note: this is done by minimizing minus the log-likelihood (which is equivalent to maximizing the log-likelihood). v) When using nlm, set hessian TRUE so that nlm stores the so-called "hessian" matrix, i.e., the 2 x 2 matrix of second derivatives. Note that since we minimize minus the log-likelihood, this is already the observed information matrix. By inverting this matrix in R, produce confidence intervals for X and a
Step by Step Solution
There are 3 Steps involved in it

Get step-by-step solutions from verified subject matter experts