Question: please provide a connected answer with clear answers and please answer all Step 1 of 1 Forest owlets are endangered. This function models the estimated
please provide a connected answer with clear answers and please answer all
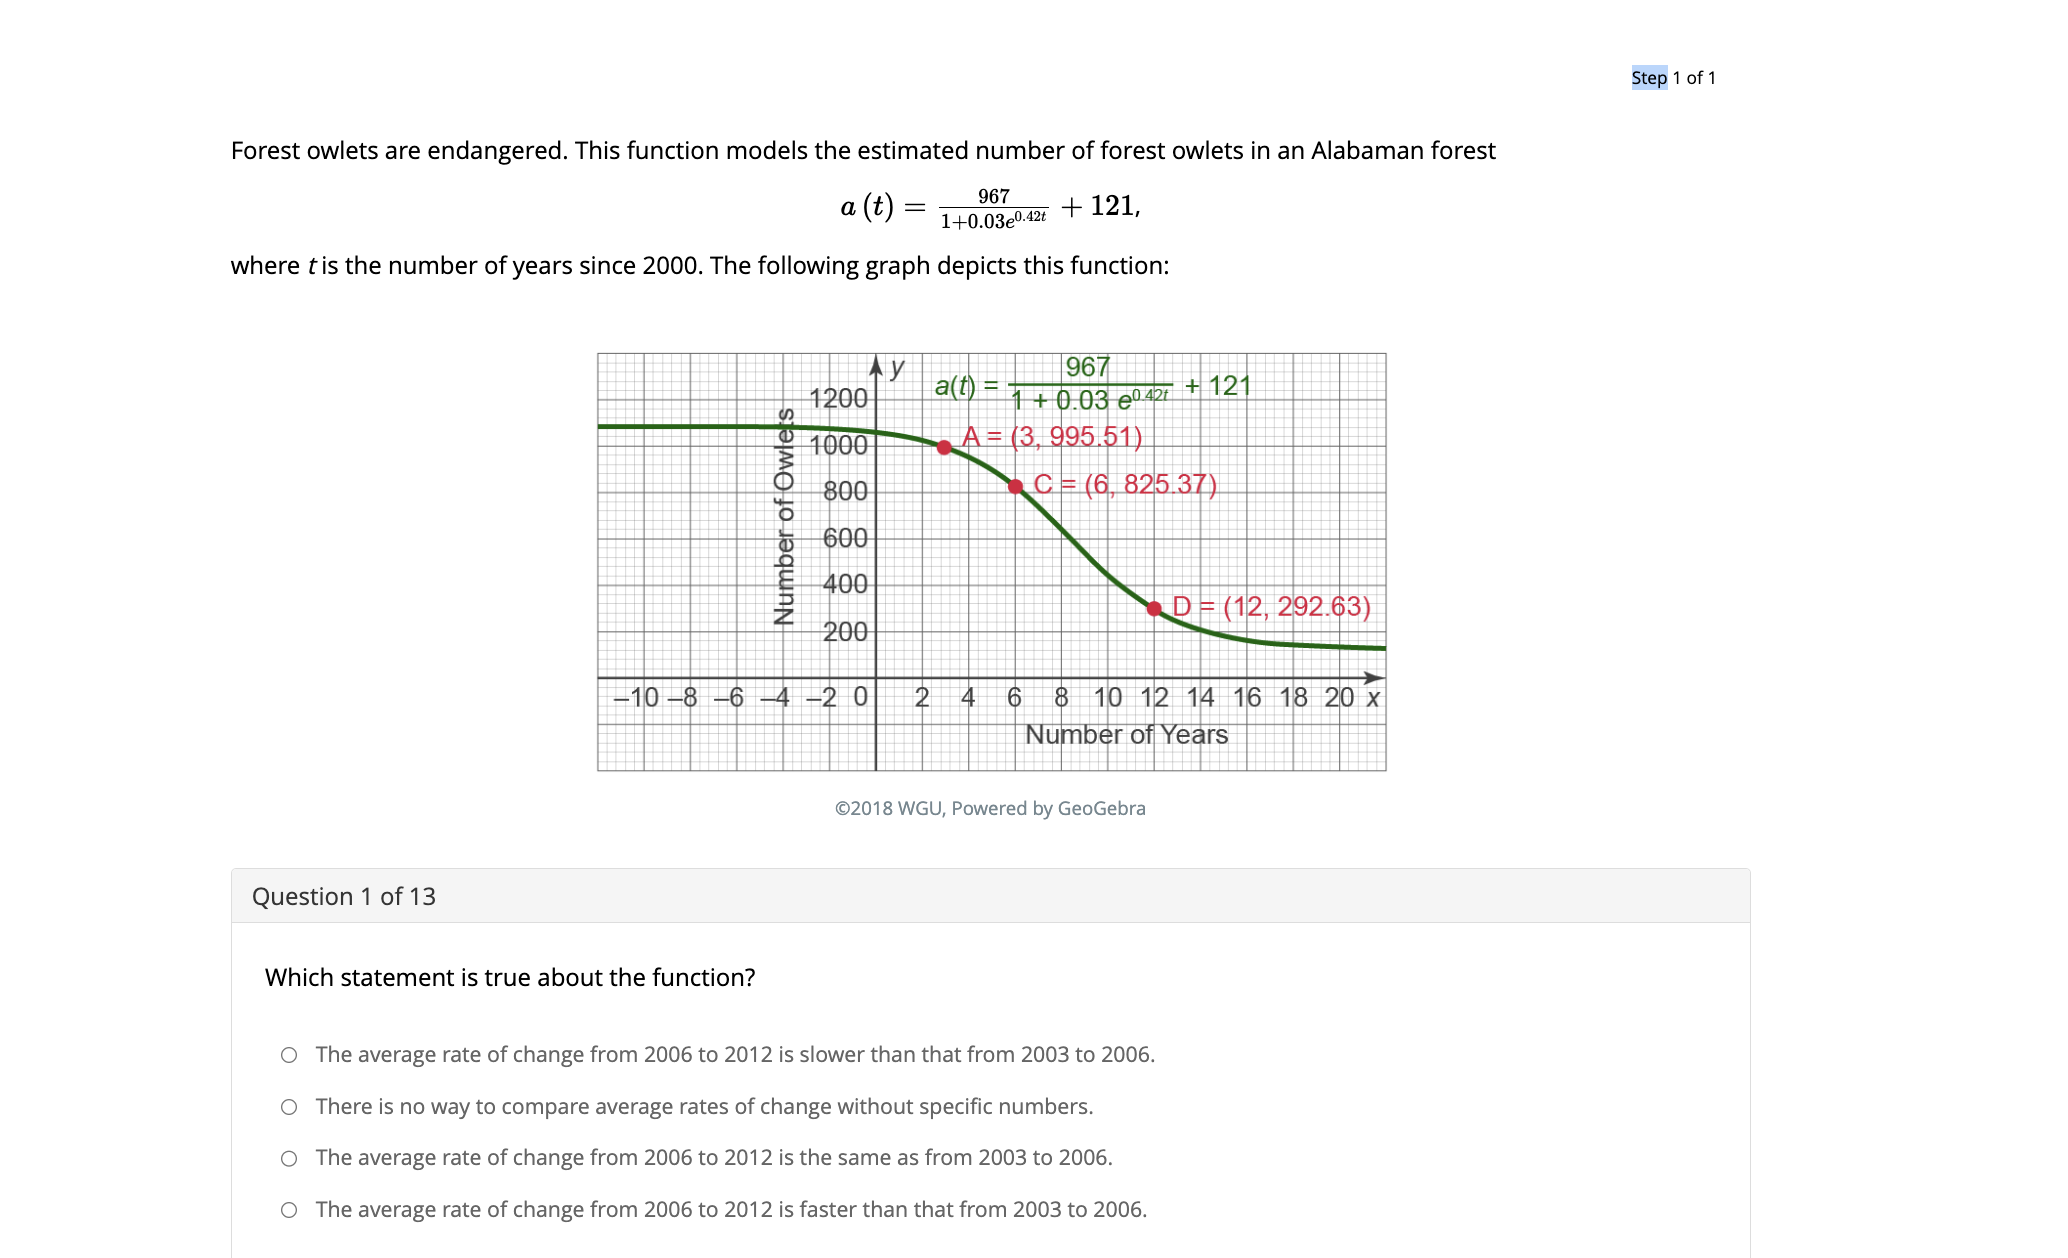
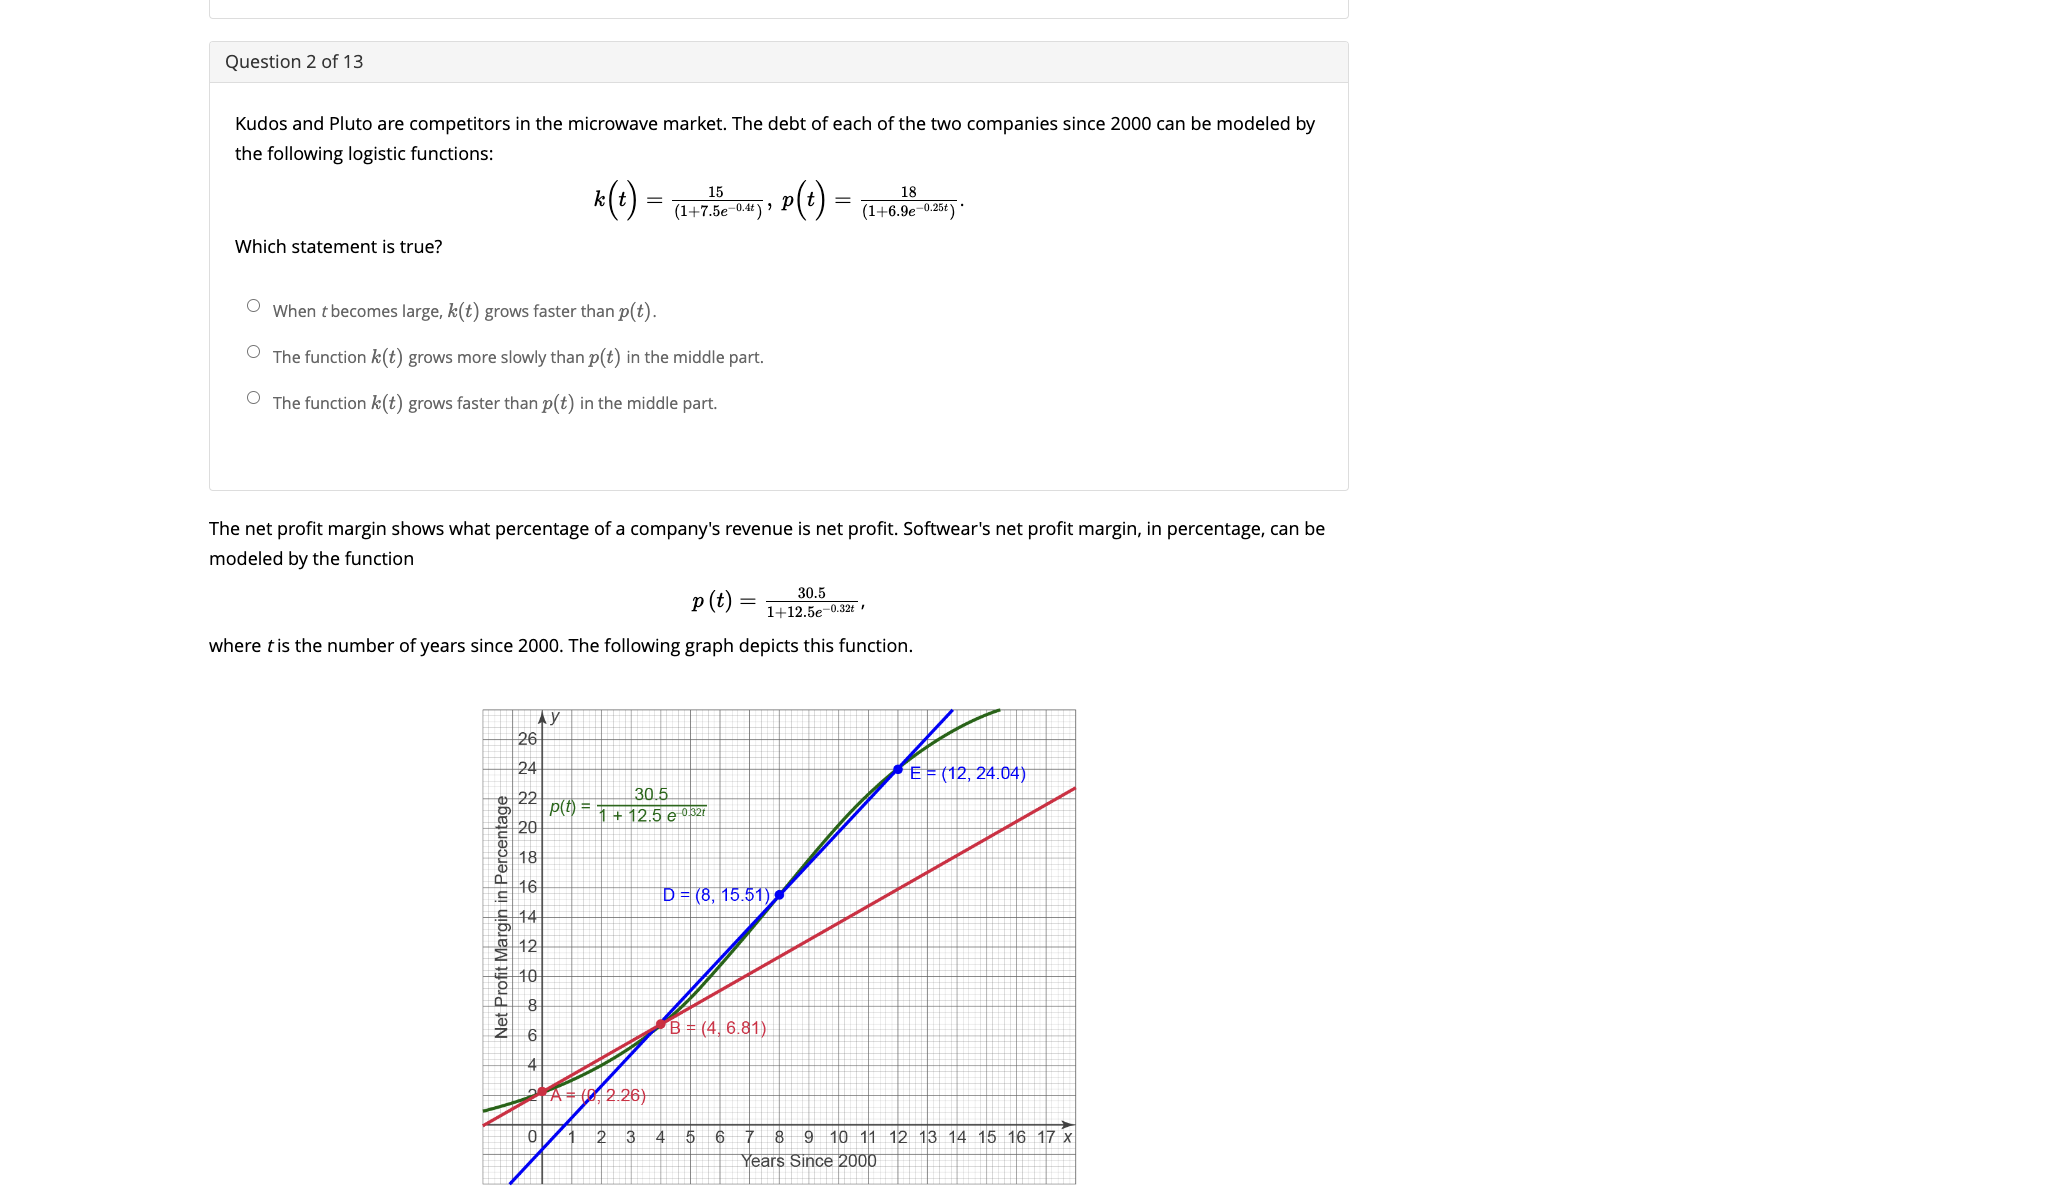
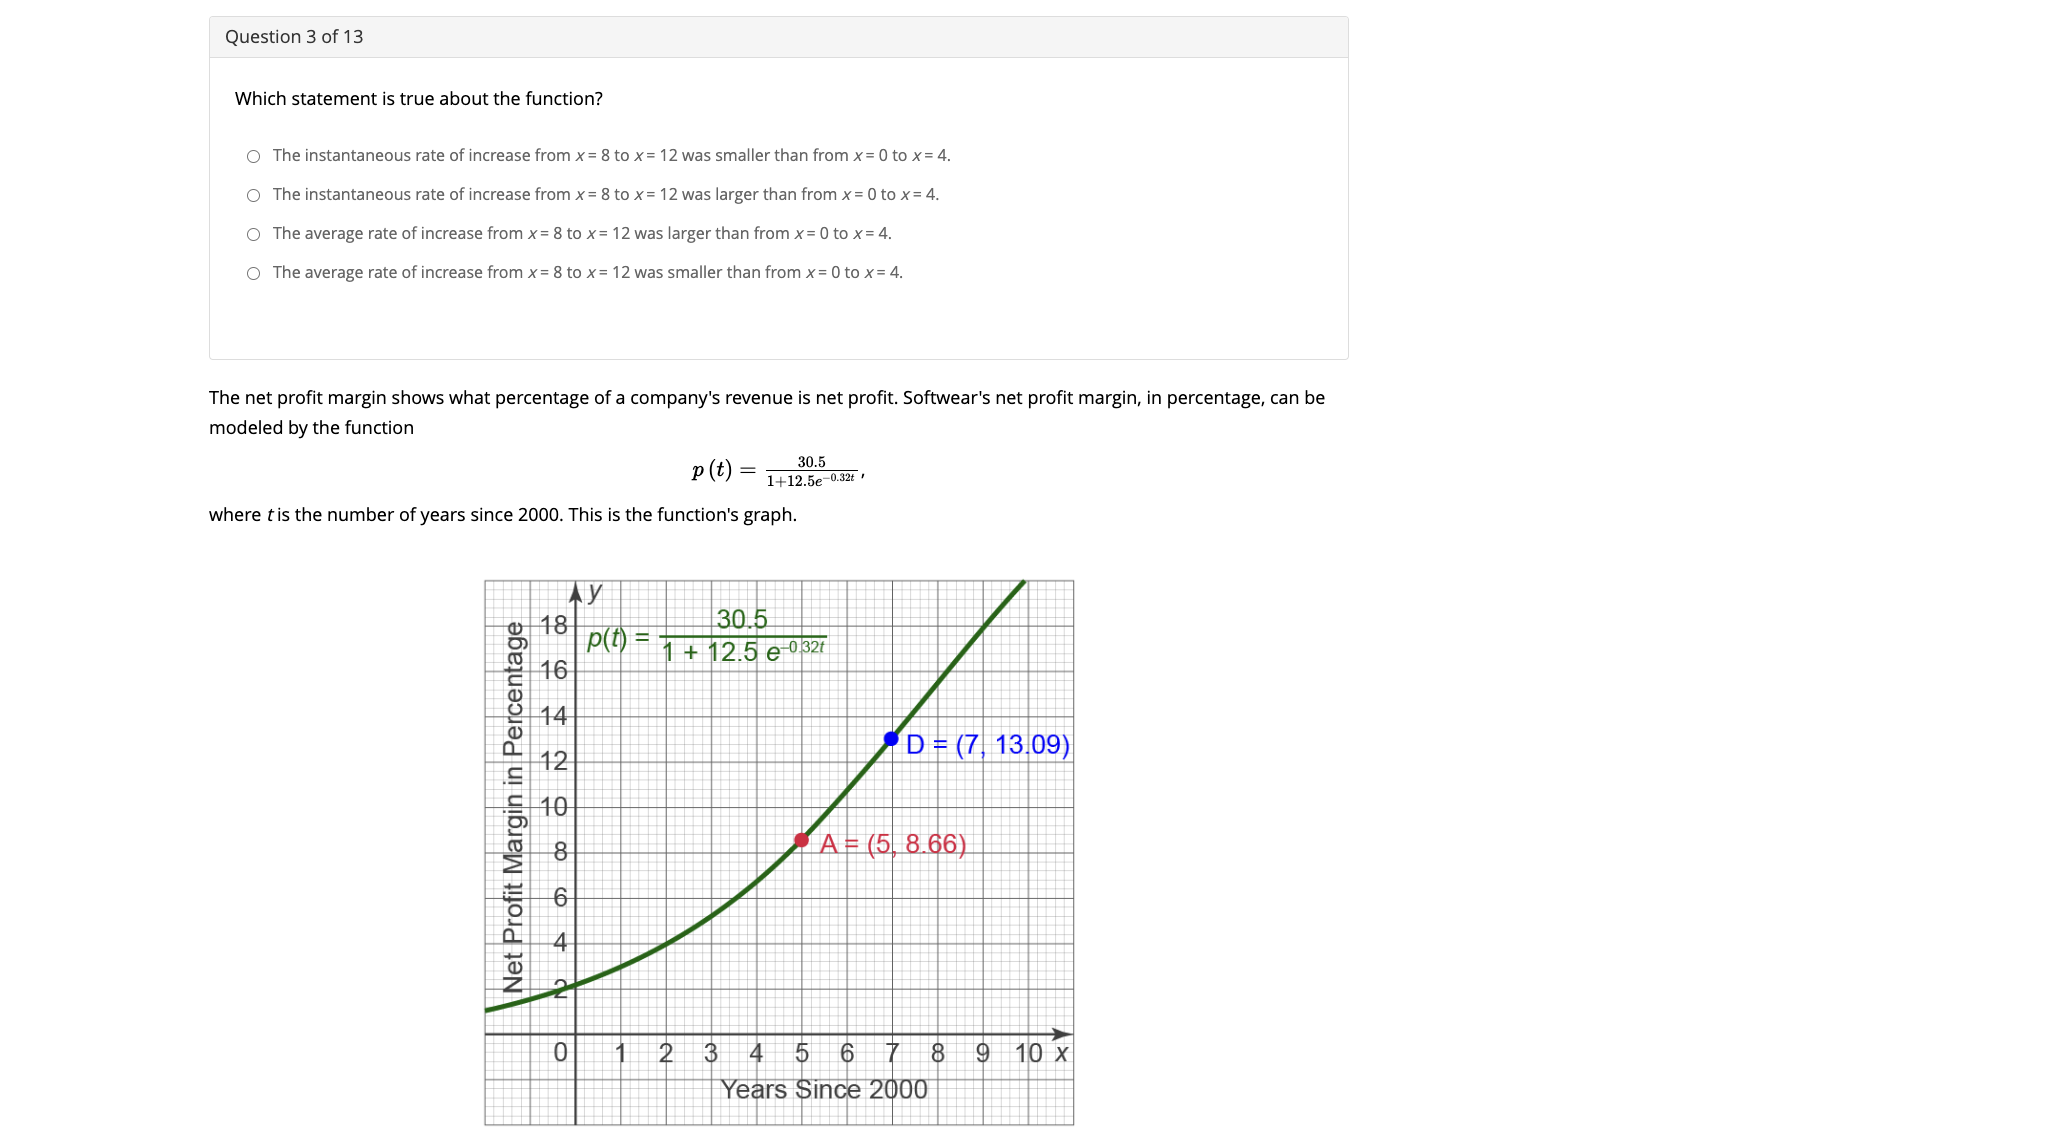
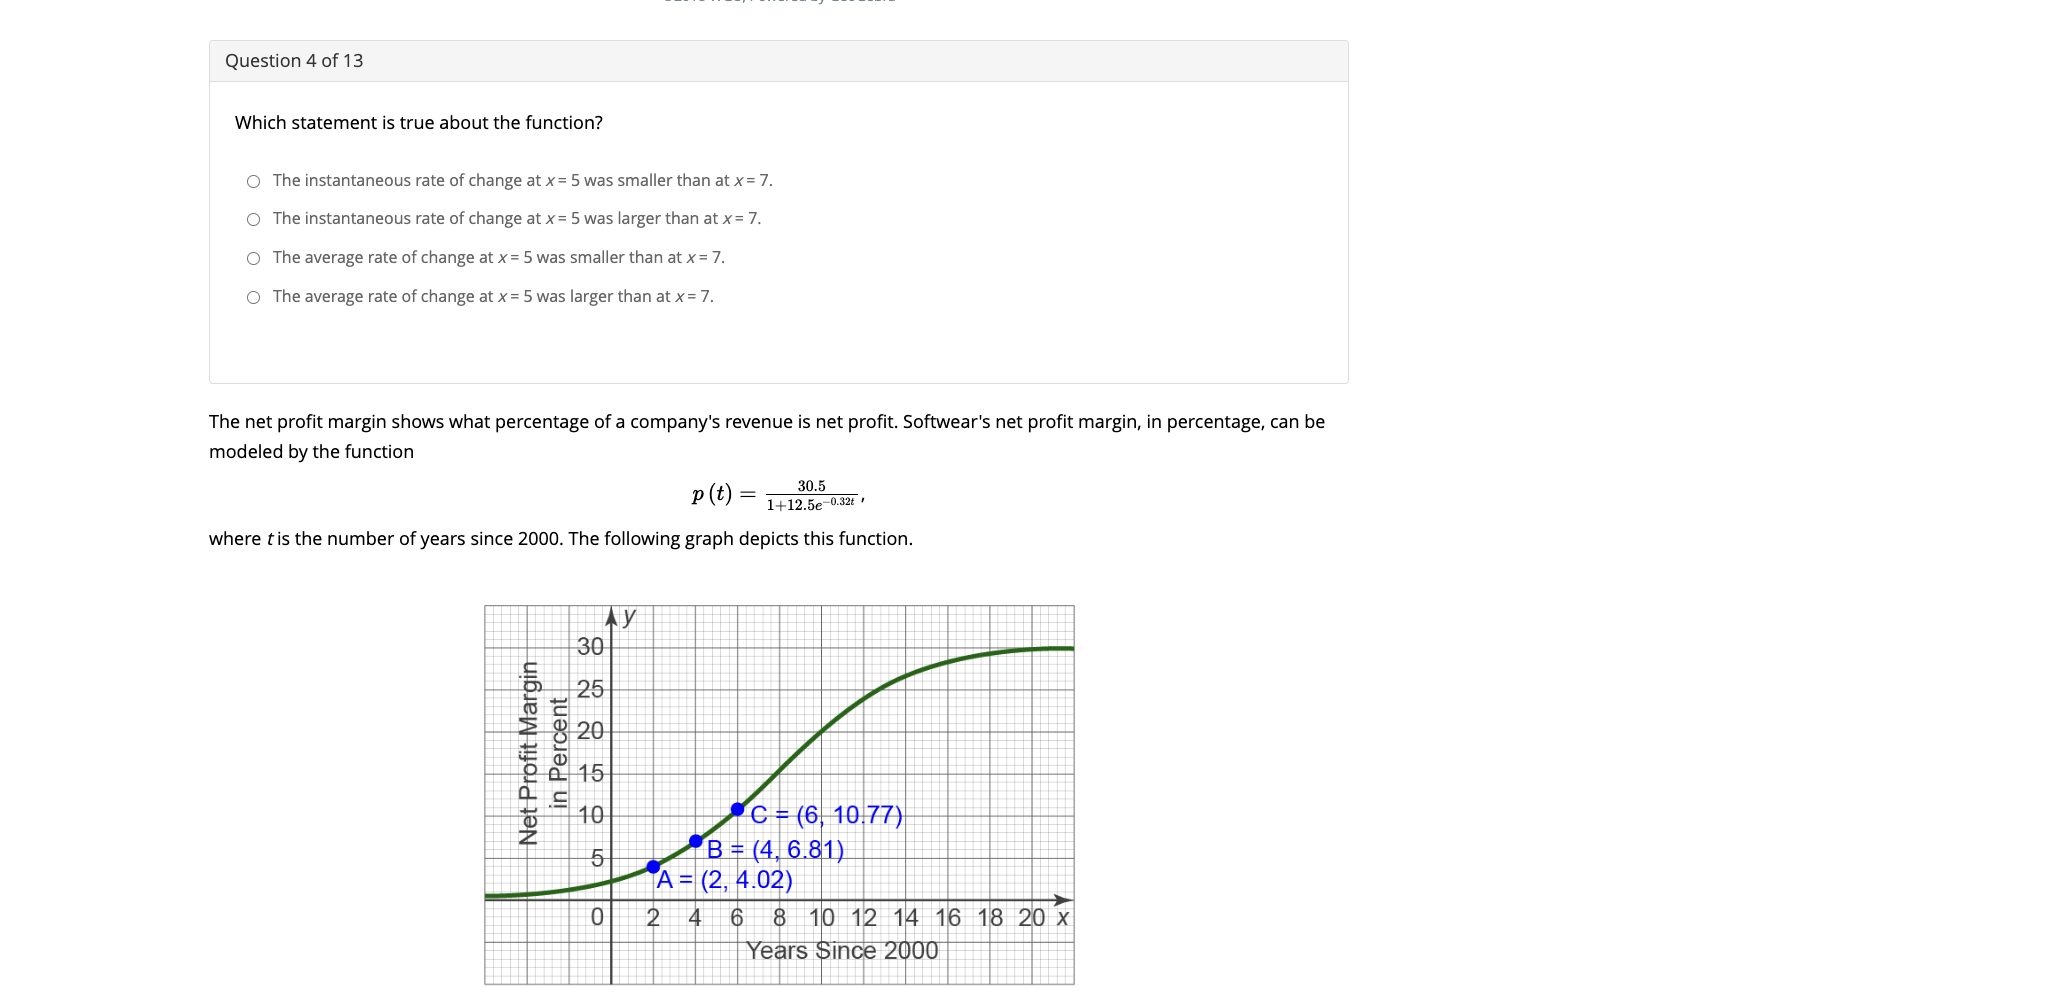
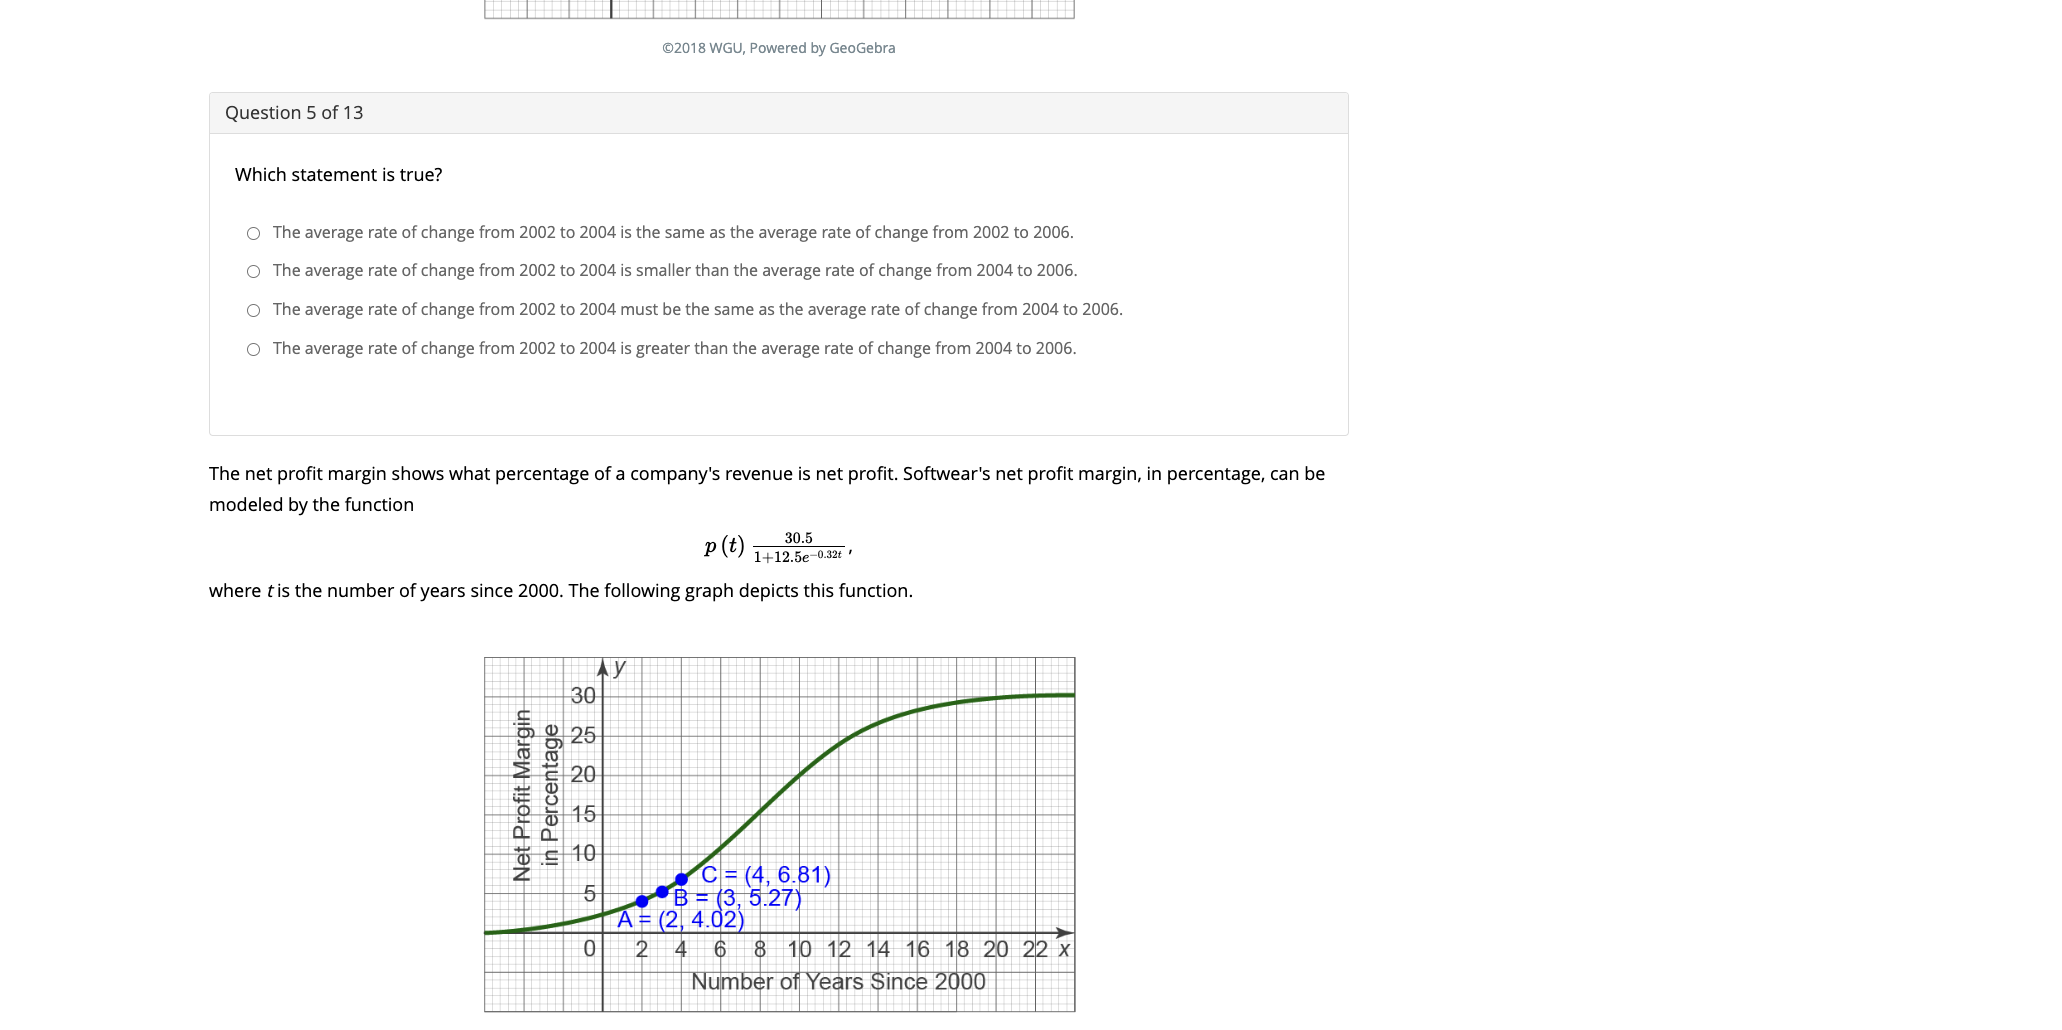
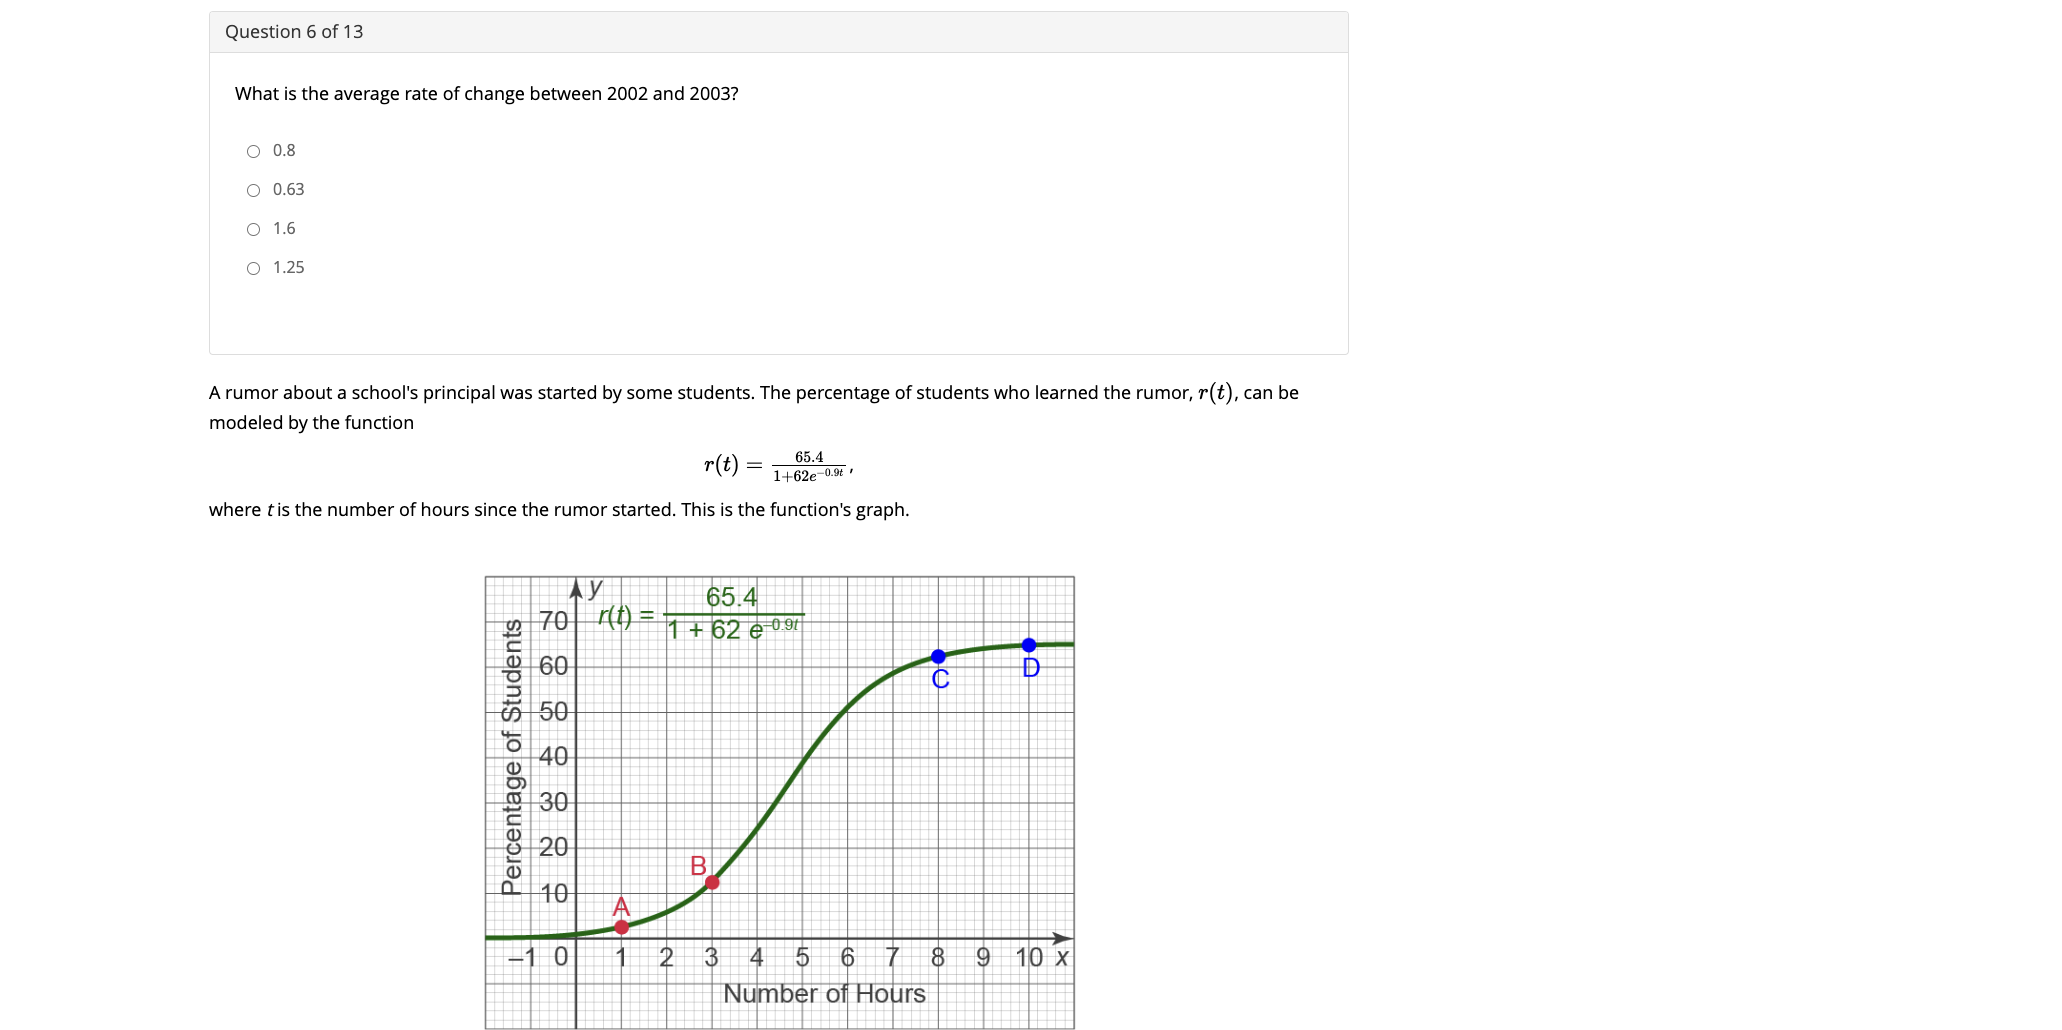
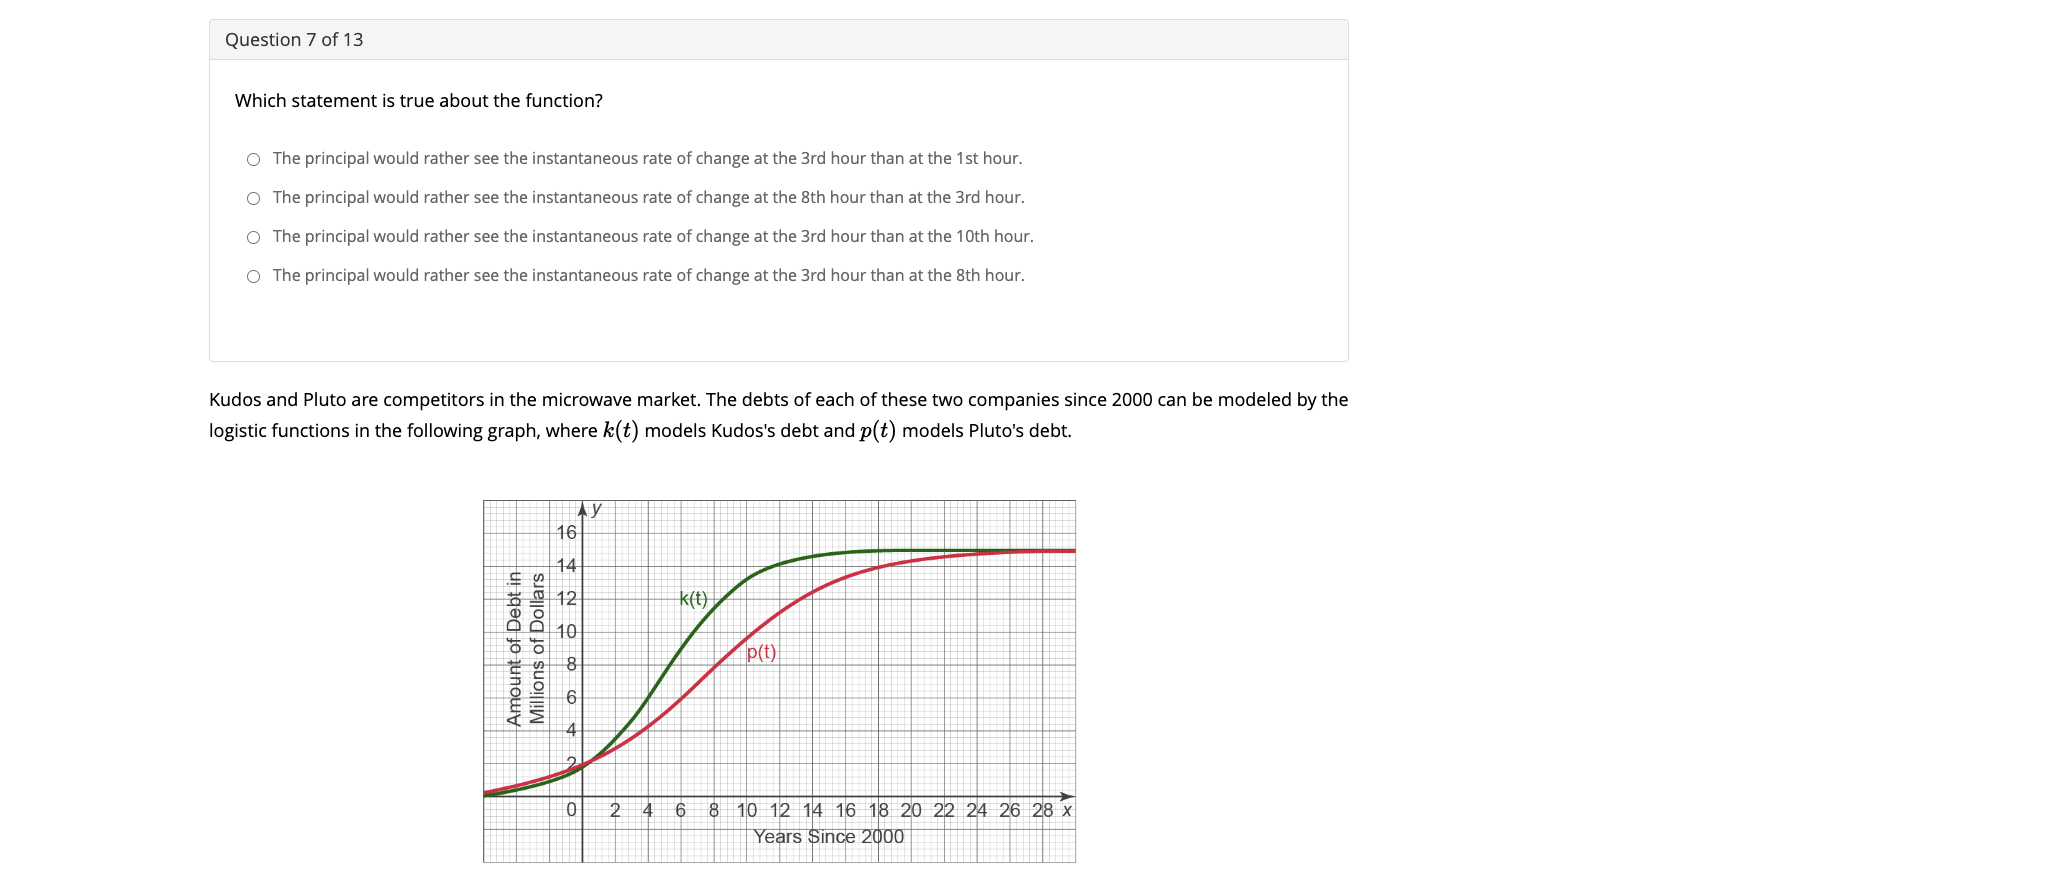
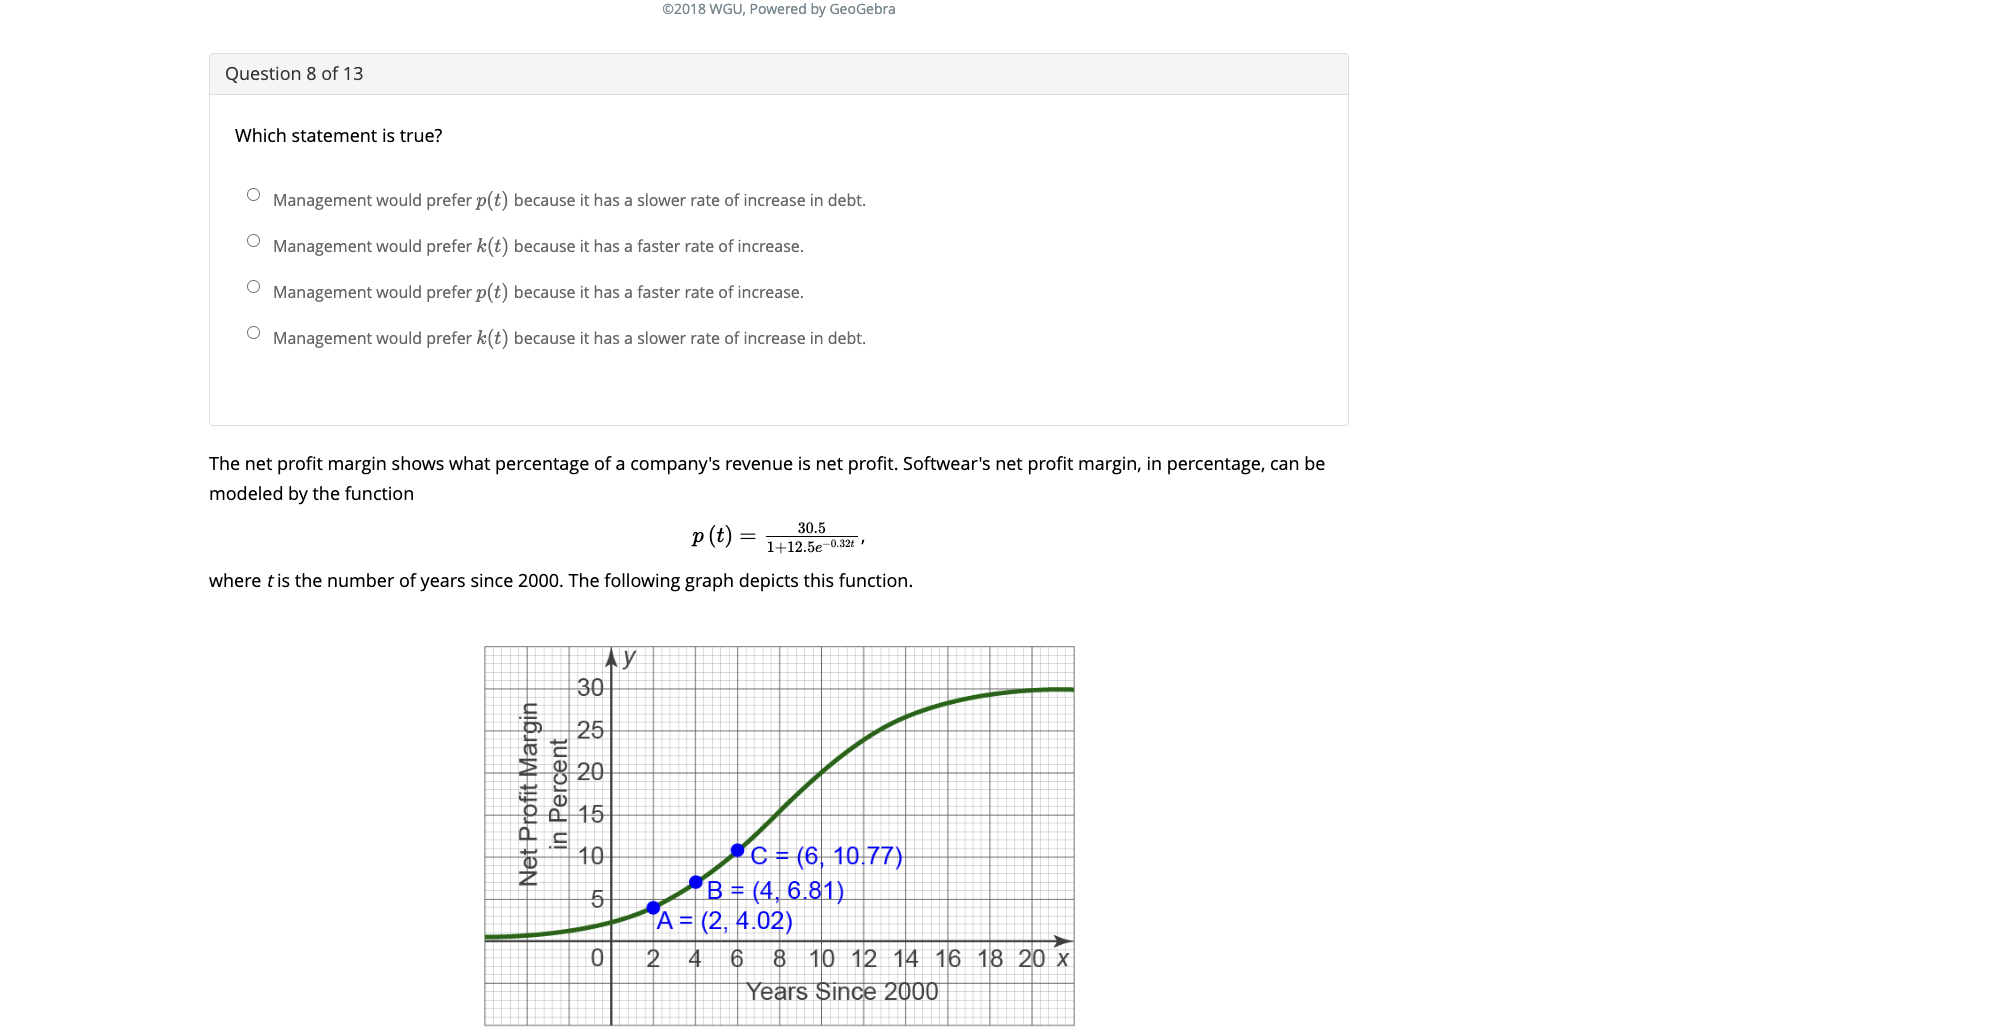
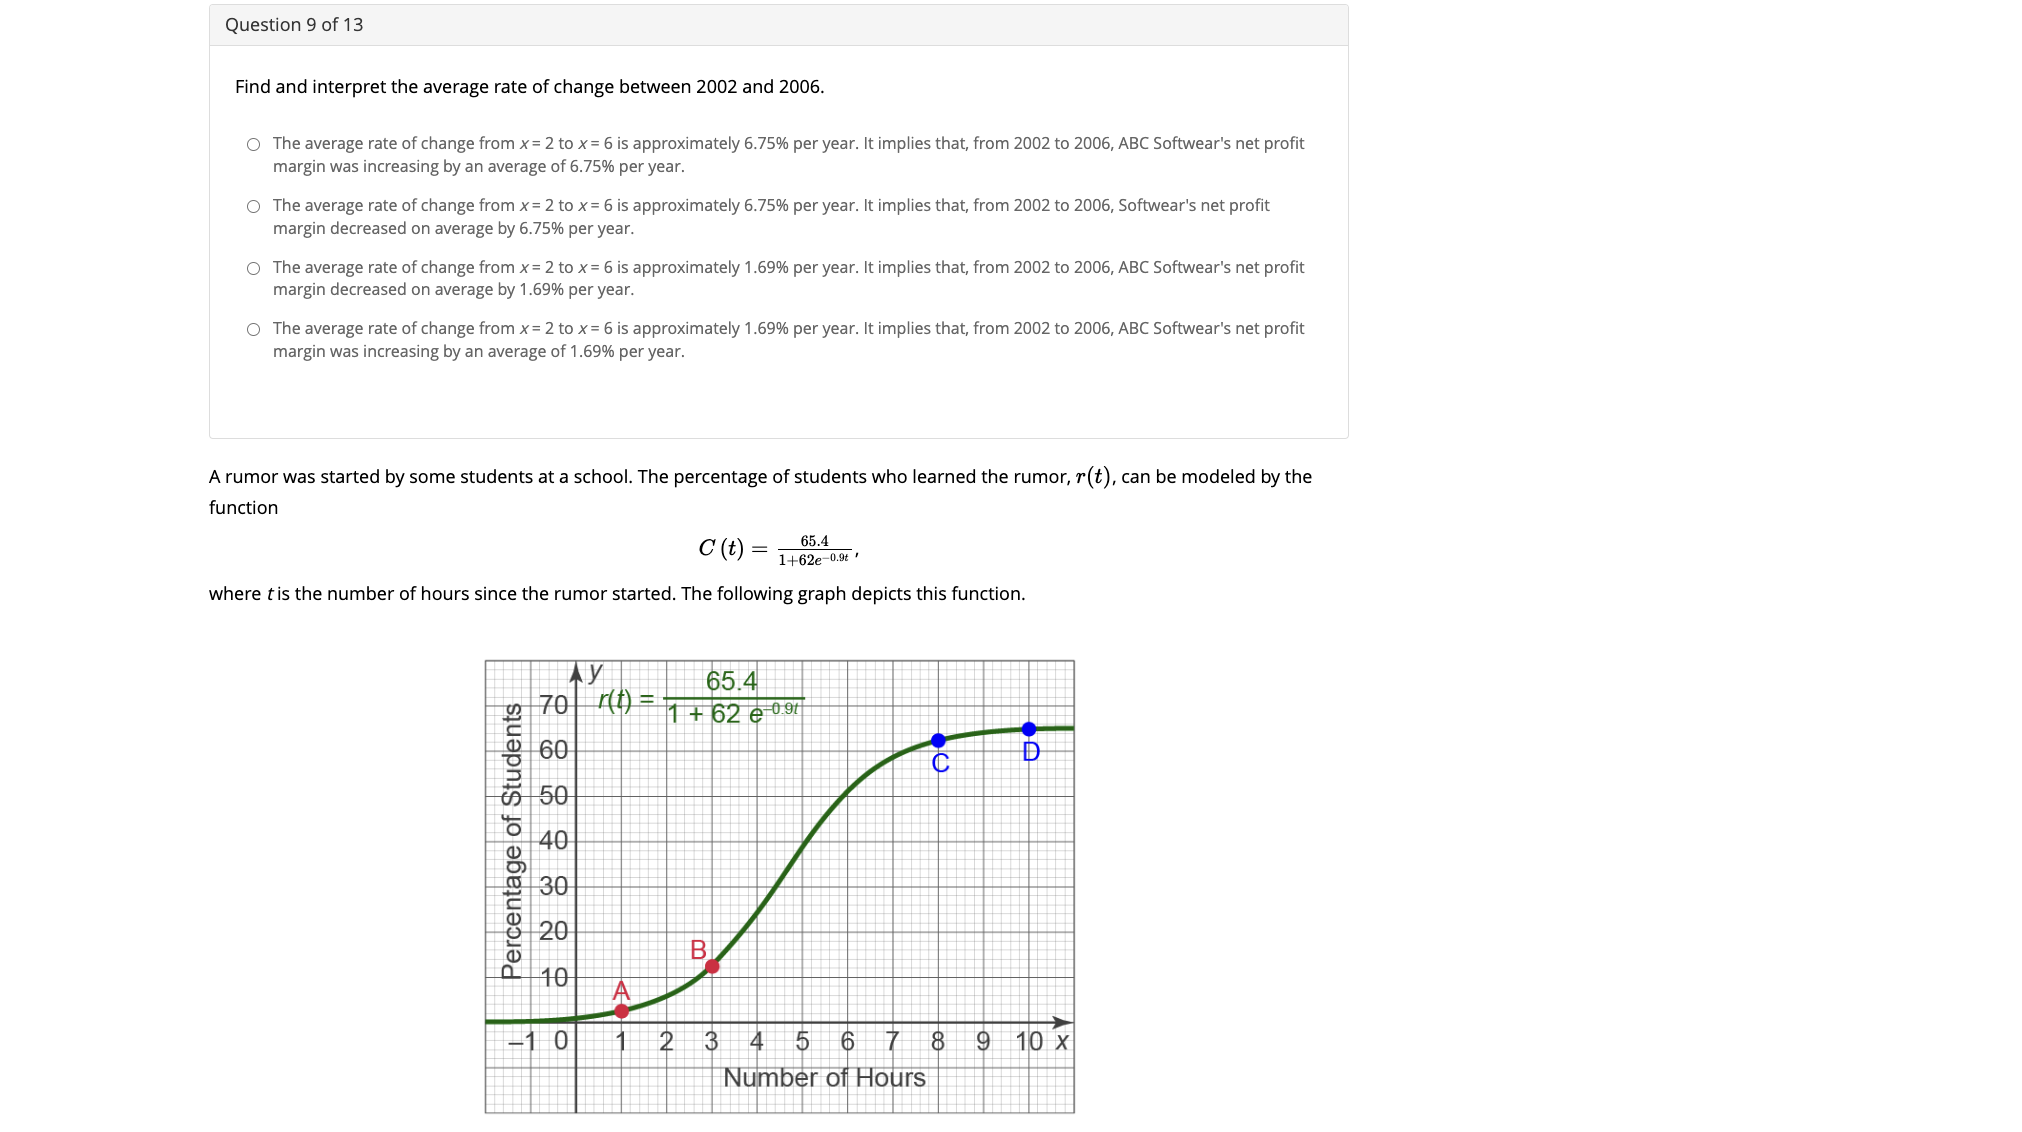
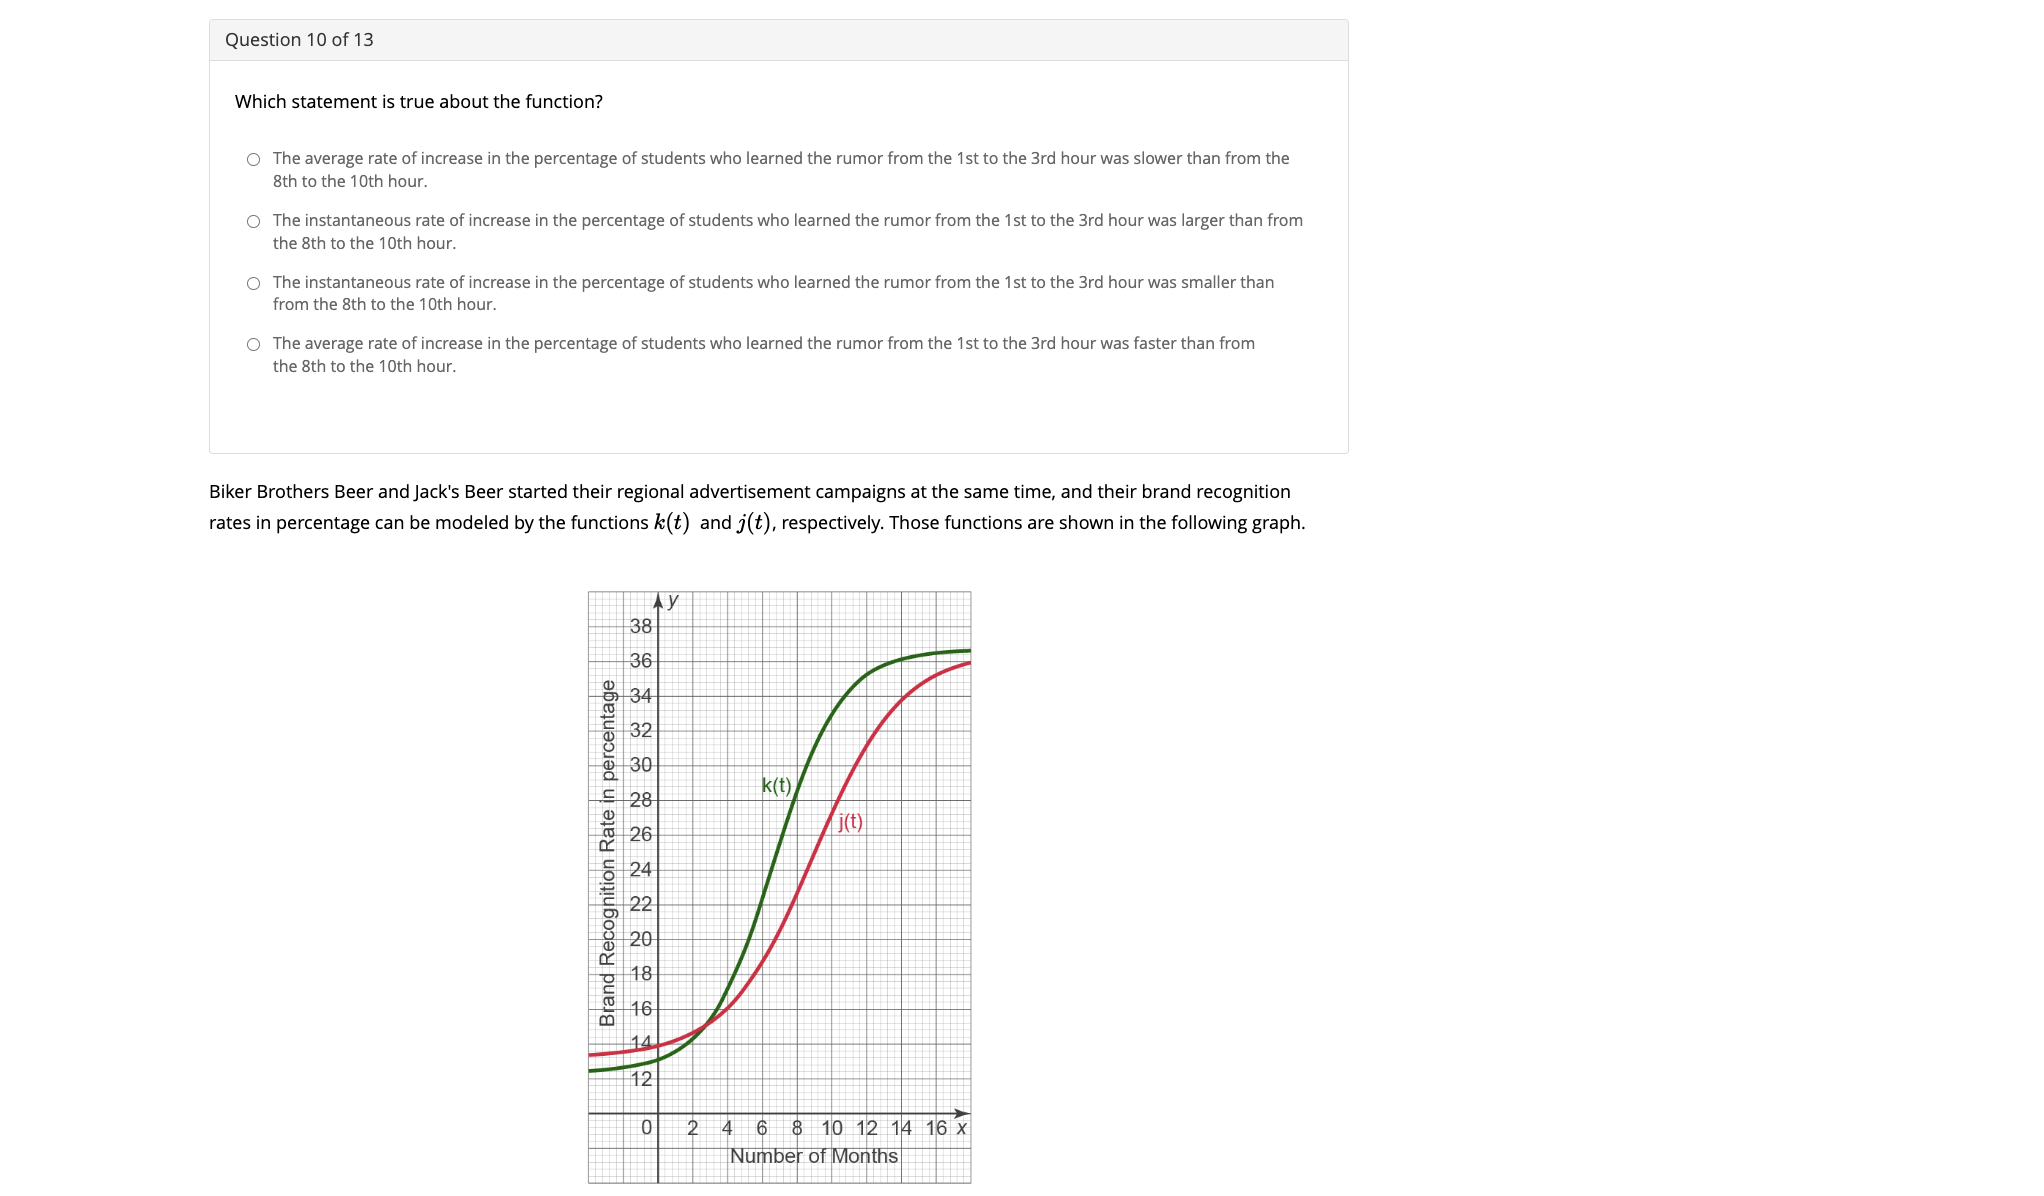
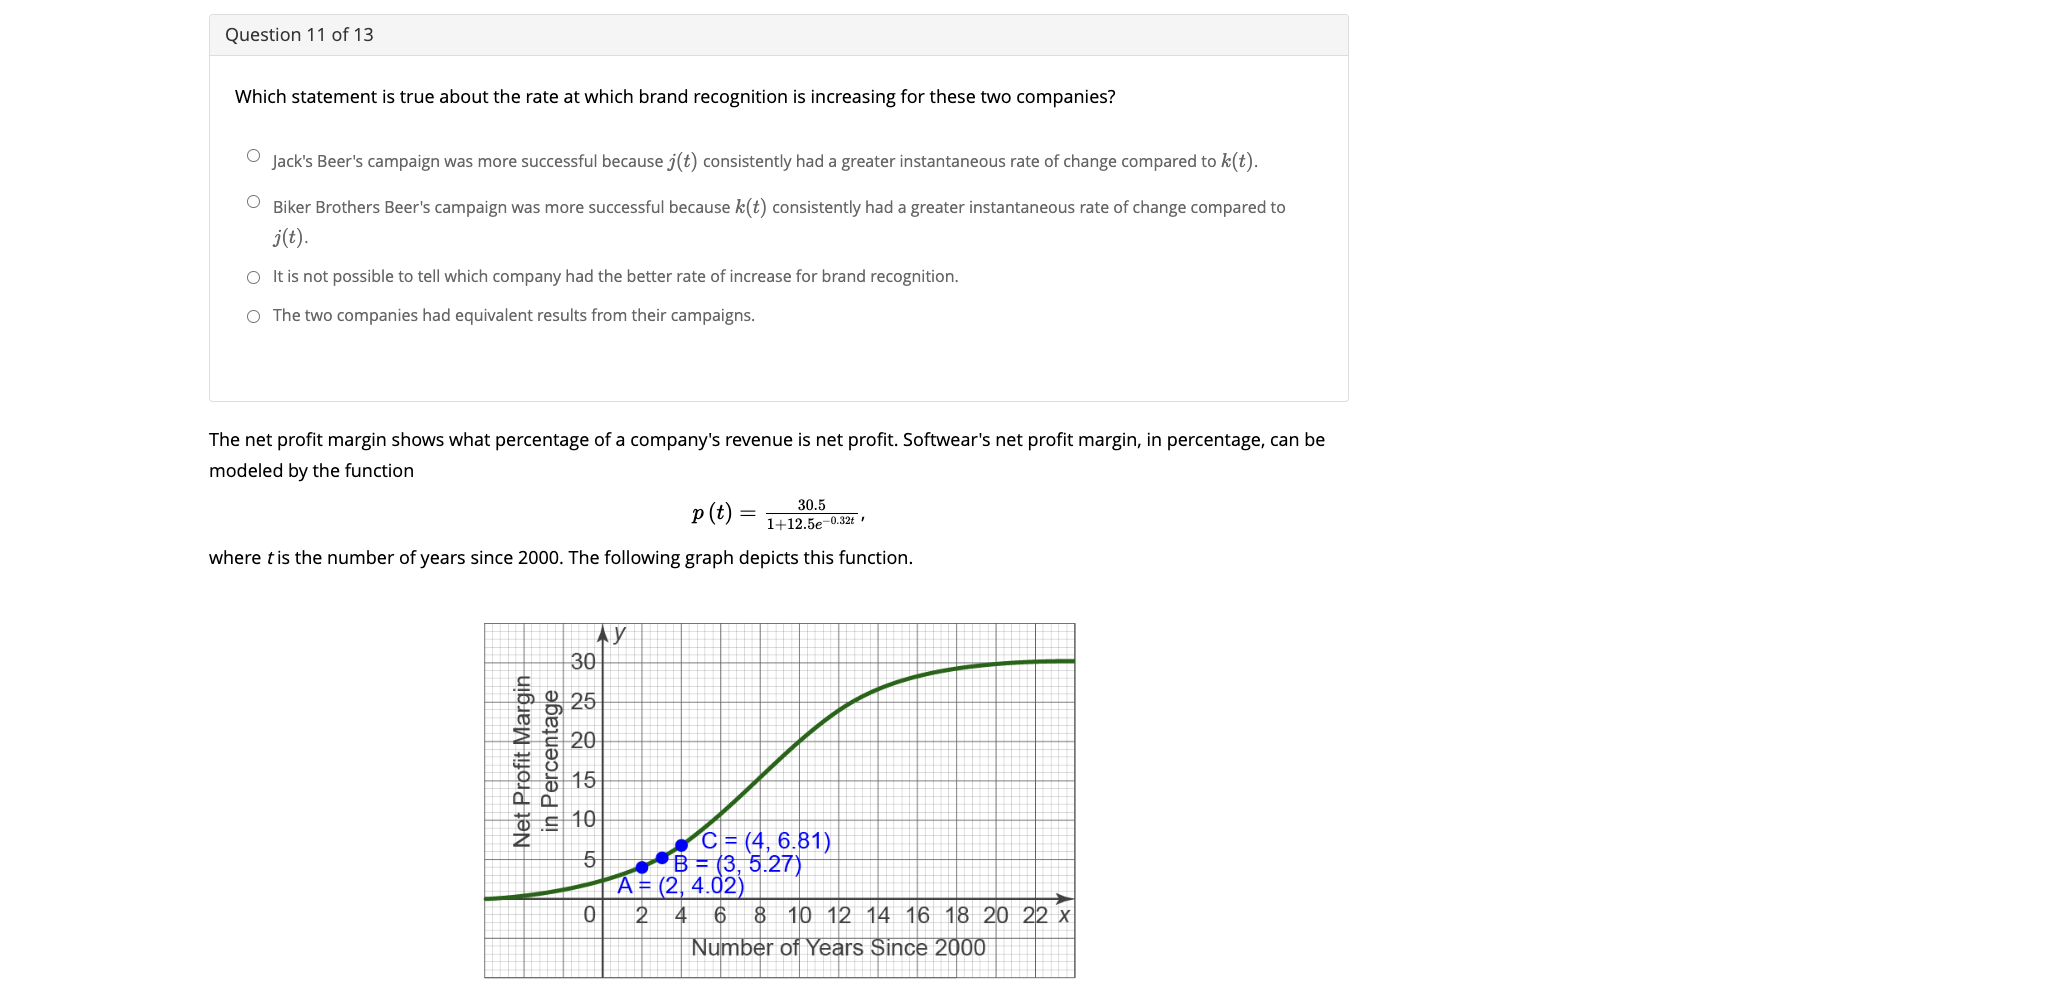
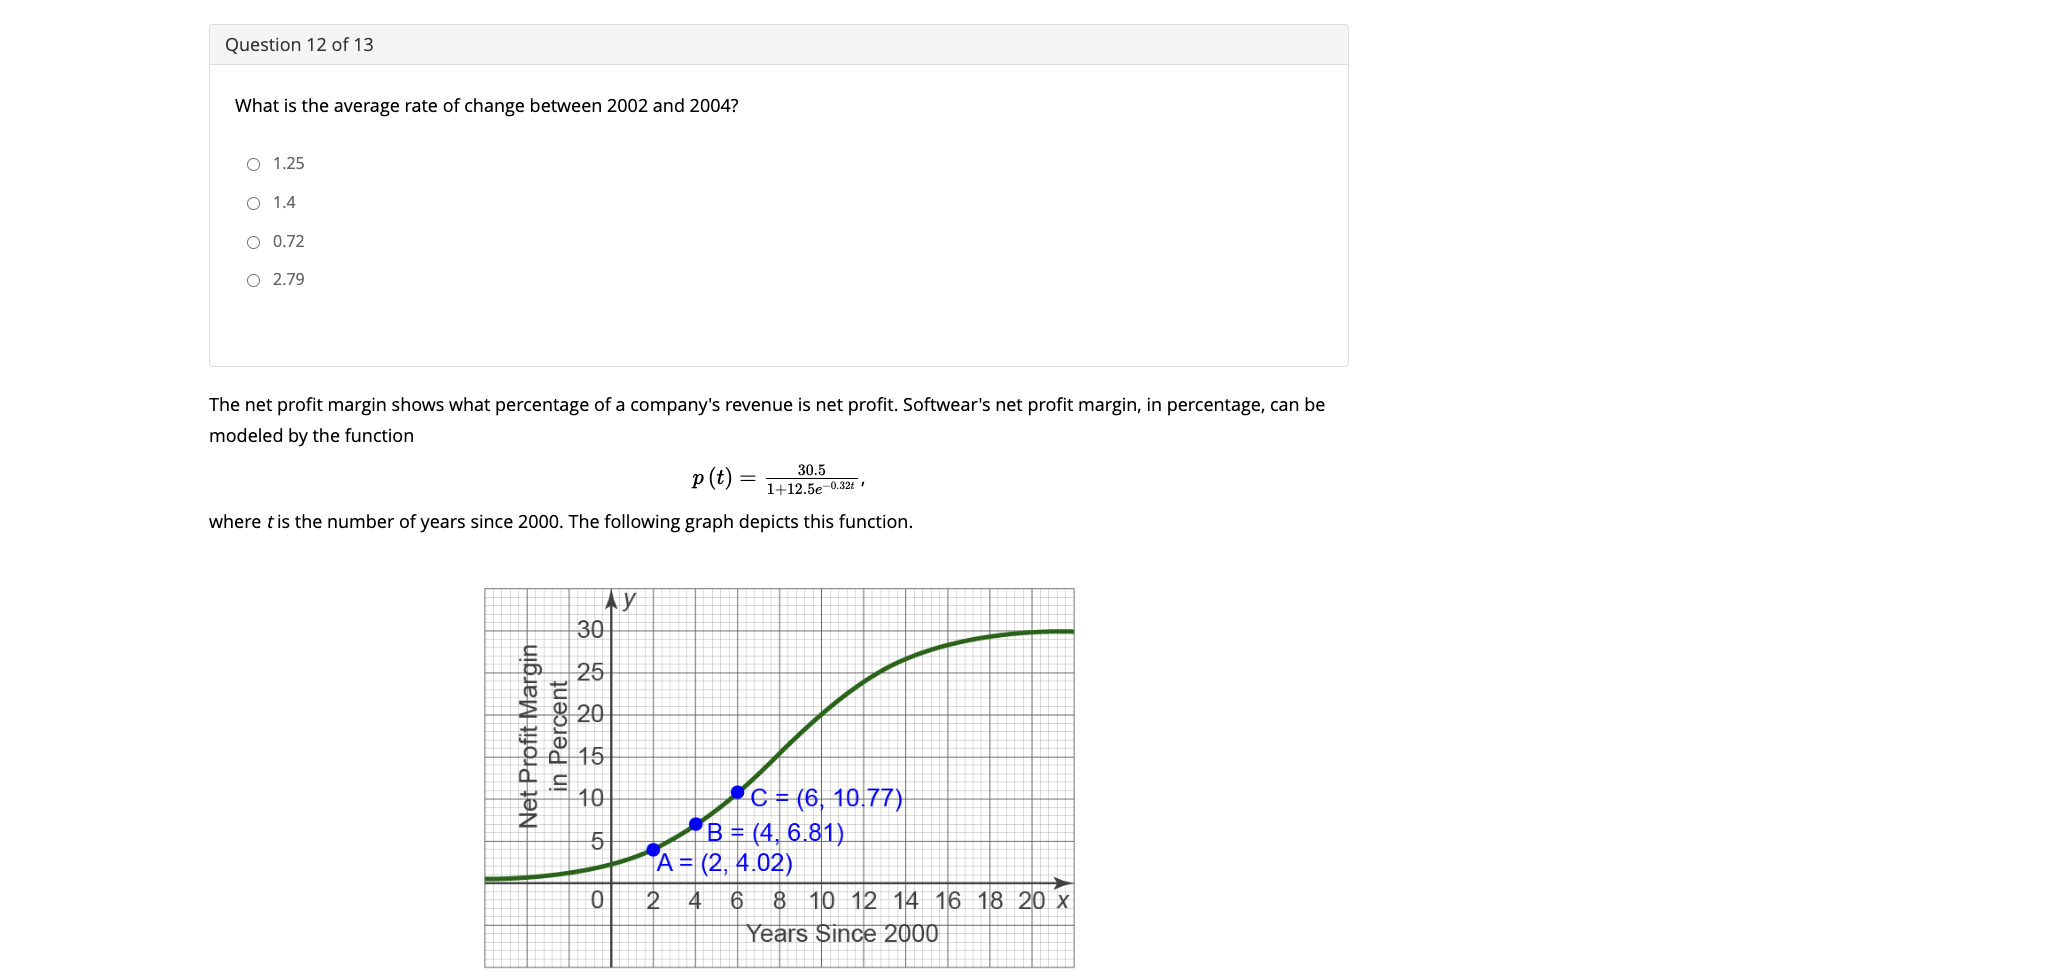
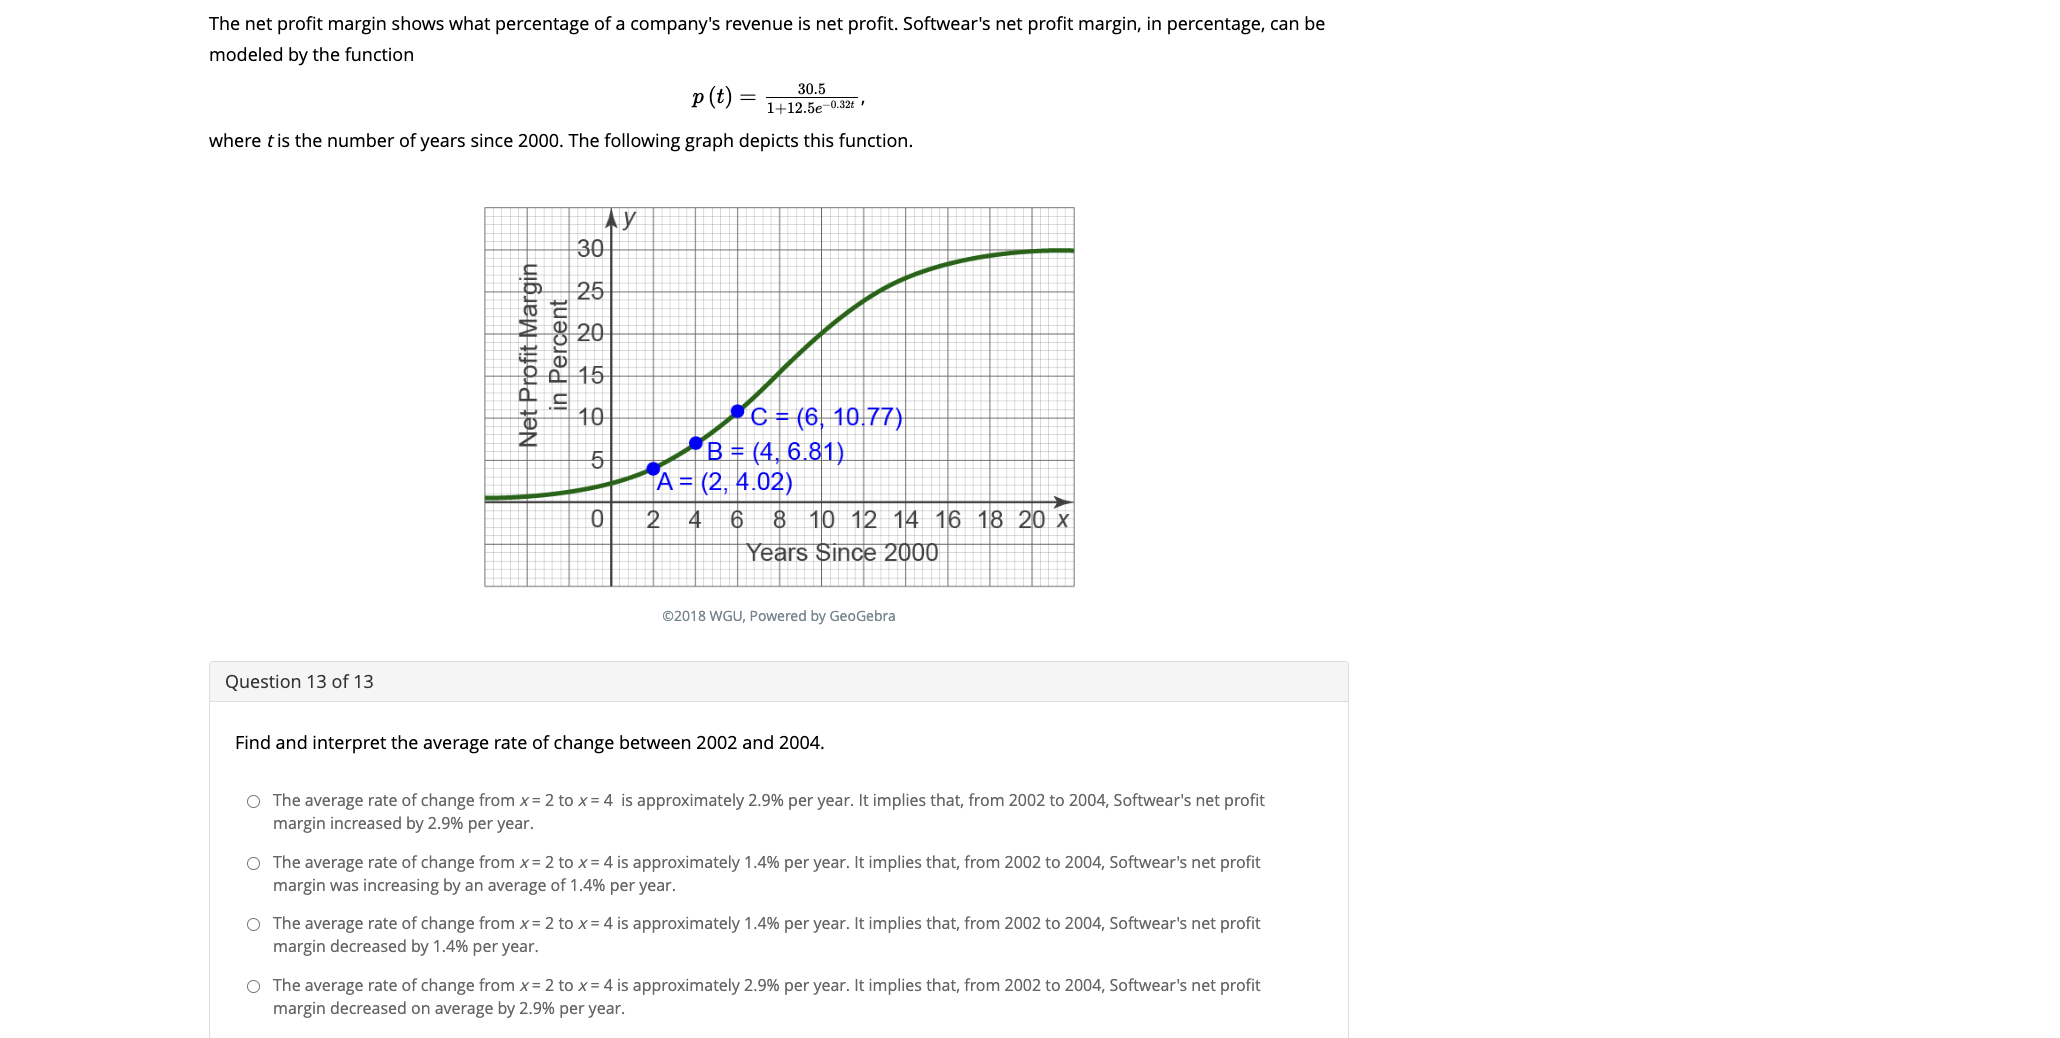
Step 1 of 1 Forest owlets are endangered. This function models the estimated number of forest owlets in an Alabaman forest a.(t) = 153%? +121. where tis the number of years since 2000. The following graph depicts this function: Ay a(_rl= 967 ,+121 2018 WGU, Powered by GeoGebra Question 1 0113 Which statement is true about the function? 0 The average rate of change from 2006 to 2012 is slower than that from 2003 to 2006. 0 There is no way to compare average rates ofchange without specific numbers. 0 The average rate of change from 2006 to 2012 is the same as from 2003 to 2006. O The average rate of change from 2006 to 2012 is faster than that from 2003 to 2006. Question 2 of 13 Kudos and Pluto are competitors in the microwave market. The debt of each of the two companies since 2000 can be modeled by the following logistic functions: (t) = (1+7.be ON) ; p (t) = 18 (1+6.9e-0.25t ) . Which statement is true? When t becomes large, k(t) grows faster than p(t). The function k(t) grows more slowly than p(t) in the middle part. The function k(t) grows faster than p(t) in the middle part. The net profit margin shows what percentage of a company's revenue is net profit. Softwear's net profit margin, in percentage, can be modeled by the function P (t) = 30.5 1+12.5e-0.32t where tis the number of years since 2000. The following graph depicts this function. AY 26 24 E - ( 12 , 24.04) 30.5 p(1) = 1 + 12.5 e 0 327 18 D = (8, 15.51 ) Net Profit Margin in Percentage B - (4 6.81) 2 A - (8 2.26) 0 1 2 3 4 5 6 7 8 9 10 11 12 13 14 15 16 17 X Years Since 2000Question 3 of 13 Which statement is true about the function? O The instantaneous rate of increase from x = 8 to x = 12 was smaller than from x = 0 to x = 4. O The instantaneous rate of increase from x = 8 to x = 12 was larger than from x = 0 to x = 4. O The average rate of increase from x = 8 to x = 12 was larger than from x = 0 to x = 4. O The average rate of increase from x = 8 to x= 12 was smaller than from x = 0 to x = 4. The net profit margin shows what percentage of a company's revenue is net profit. Softwear's net profit margin, in percentage, can be modeled by the function p (t) = 30.5 1+12.5e-0.32t , where tis the number of years since 2000. This is the function's graph. Ay 18 30.5 1 + 12.5 e 0 321 16 14 D = (7, 13 09) Net Profit Margin in Percentage A (5 , 8 66) 0 1 2 3 4 5 6 7 8 9 10 x Years Since 2000Question 4 of 13 Which statement is true about the function? The instantaneous rate of change at x = 5 was smaller than at x = 7. The instantaneous rate of change at x = 5 was larger than at x = 7. The average rate of change at x = 5 was smaller than at x = 7. The average rate of change at x = 5 was larger than at x = 7. The net profit margin shows what percentage of a company's revenue is net profit. Softwear's net profit margin, in percentage, can be modeled by the function p (t) = 30.5 1+12.5e-0.32t where tis the number of years since 2000. The following graph depicts this function. 30 25 20 Net Profit Margin in Percent 15 10 C = (6, 10 77) 5 B = (4, 6.81) A = (2, 4.02) 0 2 4 6 8 10 12 14 16 18 20 x Years Since 20002018 WGU, Powered by GeoGebra Question 5 of 13 Which statement is true? The average rate of change from 2002 to 2004 is the same as the average rate of change from 2002 to 2006. The average rate of change from 2002 to 2004 is smaller than the average rate of change from 2004 to 2006. The average rate of change from 2002 to 2004 must be the same as the average rate of change from 2004 to 2006. The average rate of change from 2002 to 2004 is greater than the average rate of change from 2004 to 2006. The net profit margin shows what percentage of a company's revenue is net profit. Softwear's net profit margin, in percentage, can be modeled by the function 30.5 p (t) 1+12.5e-0.32t ' where tis the number of years since 2000. The following graph depicts this function. 30 25 Net Profit Margin in Percentage C = (4, 6.81) B = (3, 5.27 ) A = (2 4.02) 0 2 4 6 8 10 12 14 16 18 20 22 x Number of Years Since 2000Question 6 of13 What is the average rate of change between 2002 and 2003? O 0.8 O 0.63 O 1.6 o 1.25 A rumor about a school's principal was started by some students. The percentage of students who learned the rumor, 7(t), can be modeled by the function '(t) = \"374% where tis the number of hours since the rumor started. This is the function's graph. Percentage of Students Number oFHours Question 7 of13 Which statement is true about the function? 0 The principal would rather see the Instantaneous rate of change at the 3rd hour than at the 1st hour. 0 The principal would rather see the Instantaneous rate of change at the Eth hour than at the 3rd hour. 0 The principal would rather see the Instantaneous rate of change at the 3rd hour than at the 10th hour. 0 The principal would rather see the Instantaneous rate of change at the 3rd hour than at the Eth hour. Kudos ancl Pluto are competitors in the microwave market. The debts of each of these two companies since 2000 can be modeled by the logistic functions in the followinggraph, where Mt) models Kudos's debt andp(t) models Pluto's debt. U 14 2 =1; 0 \\A1n \"3 _P(l) 5 :6 E 0 3l63101 2242625? @2018 WGU, Powered by GeoGebra Question 8 of 13 Which statement is true? Management would prefer p(t) because it has a slower rate of increase in debt. Management would prefer k(t) because it has a faster rate of increase. Management would prefer p(t) because it has a faster rate of increase. Management would prefer k(t) because it has a slower rate of increase in debt. The net profit margin shows what percentage of a company's revenue is net profit. Softwear's net profit margin, in percentage, can be modeled by the function p (t) = 30.5 1+12.5e-0.32t , where tis the number of years since 2000. The following graph depicts this function. Ay 30 25 20 in Percent Net Profit Margin C = (6, 10 77) 5 B = (4, 6.81 ) A = (2, 4.02) 0 2 4 6 8 10 12 14 16 18 20 x Years Since 2000Question 9 of 13 Find and interpret the average rate of change between 2002 and 2006. O The average rate of change from x = 2 to x = 6 is approximately 6.75% per year. It implies that, from 2002 to 2006, ABC Softwear's net profit margin was increasing by an average of 6.75% per year. The average rate of change from x = 2 to x = 6 is approximately 6.75% per year. It implies that, from 2002 to 2006, Softwear's net profit margin decreased on average by 6.75% per year. O The average rate of change from x = 2 to x = 6 is approximately 1.69% per year. It implies that, from 2002 to 2006, ABC Softwear's net profit margin decreased on average by 1.69% per year. O The average rate of change from x = 2 to x = 6 is approximately 1.69% per year. It implies that, from 2002 to 2006, ABC Softwear's net profit margin was increasing by an average of 1.69% per year. A rumor was started by some students at a school. The percentage of students who learned the rumor, r(t), can be modeled by the function C (t) = - 65.4 1+62e-0.at ' where tis the number of hours since the rumor started. The following graph depicts this function. Ay 65.4 70 r(t )= 1 + 62 6 0.9t 60 C D 60 Percentage of Students 40 30 20 B 10 -1 0 1 2 3 4 5 6 7 8 9 10 x Number of HoursQuestion 10 of 13 Which statement is true about the function? 0 The average rate of increase in the percentage of students who learned the rumor from the ist to the 3rd hour was slower than from the 9th to the 'lOth hour. 0 The instantaneous rate of increase in the percentage of students who learned the rum or from the 1st to the 3rd hour was larger than from the 8th to the 10th hour. 0 The instantaneous rate of increase in the percentage of students who learned the rum or from the 1st to the 3rd hour was smaller than from the 8th to the 'l 0th hour. 0 The average rate of increase in the percentage of students who learned the rumor from the 'lst to the 3rd hour was faster than from the 8th to the 10th hour. Biker Brothers Beer andjack's Beer started their regional advertisement campaigns at the same time, and their brand recognition rates in percentage can be modeled by the functions Mt) and j(t), respectively. Those functions are shown in the following graph. Ay aseaa k0) l\") \"gala Question 11 of 13 Which statement is true about the rate at which brand recognition is increasing for these two companies? Jack's Beer's campaign was more successful because j(t) consistently had a greater instantaneous rate of change compared to k(t). Biker Brothers Beer's campaign was more successful because k(t) consistently had a greater instantaneous rate of change compared to j(t) It is not possible to tell which company had the better rate of increase for brand recognition. O The two companies had equivalent results from their campaigns. The net profit margin shows what percentage of a company's revenue is net profit. Softwear's net profit margin, in percentage, can be modeled by the function p (t) = 30.5 1+12.5e-0.32t where tis the number of years since 2000. The following graph depicts this function. 30 in Percentage Net Profit Margin C = (4, 6.81) B = (3, 5.27) A = (2 4.02) 0 2 4 6 8 10 12 14 16 18 20 22 x Number of Years Since 2000Question 12 of 13 What is the average rate of change between 2002 and 2004? O 1.25 O 1.4 O 0.72 O 2.79 The net profit margin shows what percentage of a company's revenue is net profit. Softwear's net profit margin, in percentage, can be modeled by the function p (t) = 30.5 1+12.5e-0.326 , where tis the number of years since 2000. The following graph depicts this function. AY 30 Net Profit Margin in Percent C = (6, 10 77) B = (4, 6.81) A = (2, 4.02) 0 2 4 6 8 10 12 14 16 18 20 x Years Since 2000The net prot margin shows what percentage of a compa ny's revenue is net prot. Softwea r's net profit margin, in percentage, can be modeled by the function 110) = : where tis the number of years since 2000. The following graph depicts this function. @201 E WGU. Powered by Geuebra Question 13 of 13 Find and interpret the ave rage rate of change between 2002 and 2004. O The average rate of change from x = 2 to x: 4 is approximately 2.9% per year. It implies that. from 2002 to 2004, Softwear's net prot margin Increased by 2.9% per year. 0 The average rate of change from X = 2 to X: 415 approximately 1.4% per year. it implies that. from 2002 to 2004, Softwear's net profit margin was Increasing byari average of 'i .4% per year. 0 The average rate of change from x = 2 to X: 4 IS approximately 1.4% per year. it implies that, from 2002 to 2004, Softwear's net profit margin decreased by i .4% per year. 0 The average rate of change from X = 2 to x: 415 approximately 2.9% per year. it implies that, from 2002 to 2004, Snwear's net pmfit margin decreased on average by 2.9% per year
Step by Step Solution
There are 3 Steps involved in it
1 Expert Approved Answer
Step: 1 Unlock
Question Has Been Solved by an Expert!
Get step-by-step solutions from verified subject matter experts
Step: 2 Unlock
Step: 3 Unlock
Students Have Also Explored These Related Mathematics Questions!