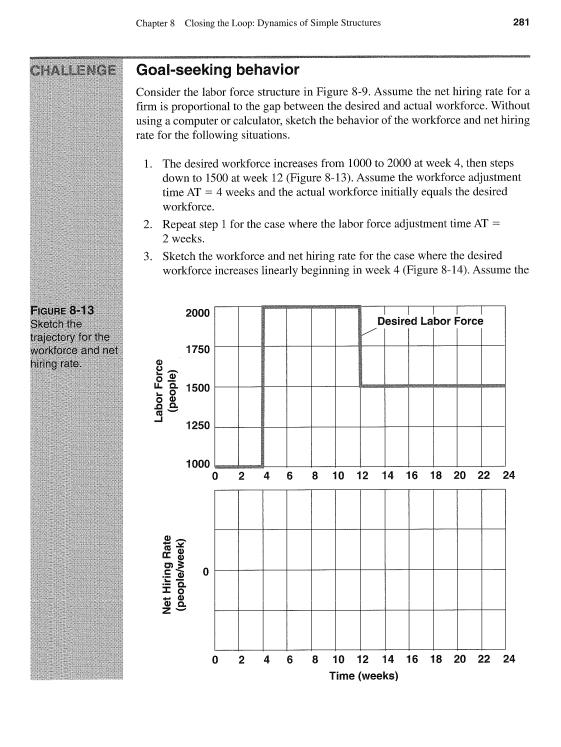
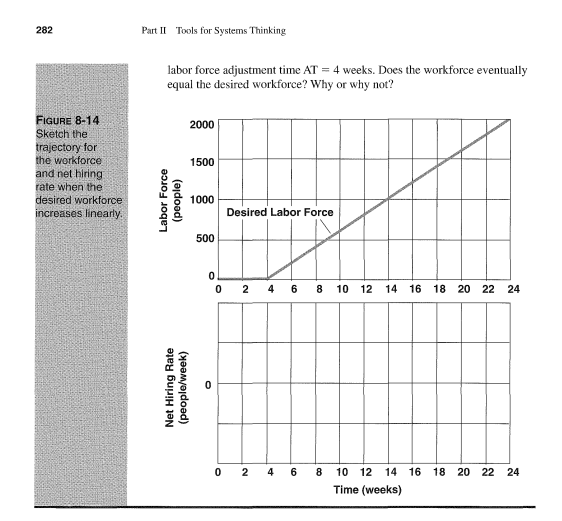
Question: Please provide a sketch, too. Chapter 8 Closing the Loop: Dynamics of Simple Structures 281 Goal-seeking behavior Consider the labor force structure in Figure 8-9,

Please provide a sketch, too.

Please provide a sketch, too. Chapter 8 ClosingPlease provide a sketch, too. Chapter 8 Closing
Chapter 8 Closing the Loop: Dynamics of Simple Structures 281 Goal-seeking behavior Consider the labor force structure in Figure 8-9, Assume the net hiring rate for a firm is proportional to the gap between the desired and actual workforce, Without using a computer or calculator, sketch the behavior of the workforce and net hiring rate for the following situations, 1. The desired workforce increases from 1000 to 200) at week 4, then steps down to 1500 at week 12 (Figure 8-13), Assume the workforce adjusiment time AT = 4 weeks and the actual workforce initially equals the desired workforce. 2. Repeat step | forthe case where the labor force adjustment time AT = 2 weeks, 3. Sketch the workforce and net hiring rate for the case where the desired workforce increases linearly beginning in week 4 (Pigure 8-14), Assume the Desired Labor Force o 2 4 6 8 10 12 14 16 18 20 22 24 Net Hiring Rate (people/week) a 4 6 8 10 12 14 16 18 20 22 24 Time (weeks) o RD 282 Part II Tools for Systems Thinking labor force adjustment time AT = 4 weeks. Does the workforce eventually equal the desired workforce? Why or why not? FIGURE 8-14 2000 Sketch the trajectory for the workforce 1500 and net hiring rate when the desired workforce Labor Force (people) 1000 increases linearly. Desired Labor Force 500 2 4 6 8 10 12 14 16 18 20 22 24 (people/week) Net Hiring Rate 0 2 4 6 3 10 12 14 16 18 20 22 24 Time (weeks)

Step by Step Solution

There are 3 Steps involved in it

1 Expert Approved Answer
Step: 1 Unlock blur-text-image
Question Has Been Solved by an Expert!

Get step-by-step solutions from verified subject matter experts

Step: 2 Unlock
Step: 3 Unlock

Students Have Also Explored These Related General Management Questions!